SEO monthly reporting is the repeated monthly process of collecting search data, checking it, explaining it and sending it, so that every month can be compared with the one before and with the same month last year. The report is the output; the process decides whether it can be trusted.
This guide covers the monthly cycle day by day, the data to save before Google stops showing it, a layout for an seo monthly report template, and a six-question test for any report you receive. For the list of sections inside a report, see our guide to the monthly SEO report; for the wider picture, start with the ecommerce SEO guide.
What is SEO monthly reporting?
A fixed routine that turns search data into a dated record of results, work done and next steps, written for the person who pays for the SEO. One report is a snapshot; SEO monthly reporting is the series, and the series is what shows a trend.
Most of the numbers come from Google’s free tools. Search Console’s Performance report shows clicks, impressions, click-through rate (clicks divided by impressions) and average position, and its default view covers the past 3 months. Google Analytics adds the business side. Its Organic Search channel counts visits that arrive through non-ad links in organic search results, so orders from that channel belong in the same report.
Reporting is different from a one-off audit and from the work itself, and SEO monthly reporting only works when it is a named job with an owner. If you are still deciding what the work should be, our monthly SEO package guide covers what each quarter should deliver; this guide covers how the results are reported back.
What does an SEO monthly reporting cycle look like?
Seven days, in the same order every month: pull the data, check it, write the explanation, review it and send it. Repeating the order is what makes the months of SEO monthly reporting comparable.
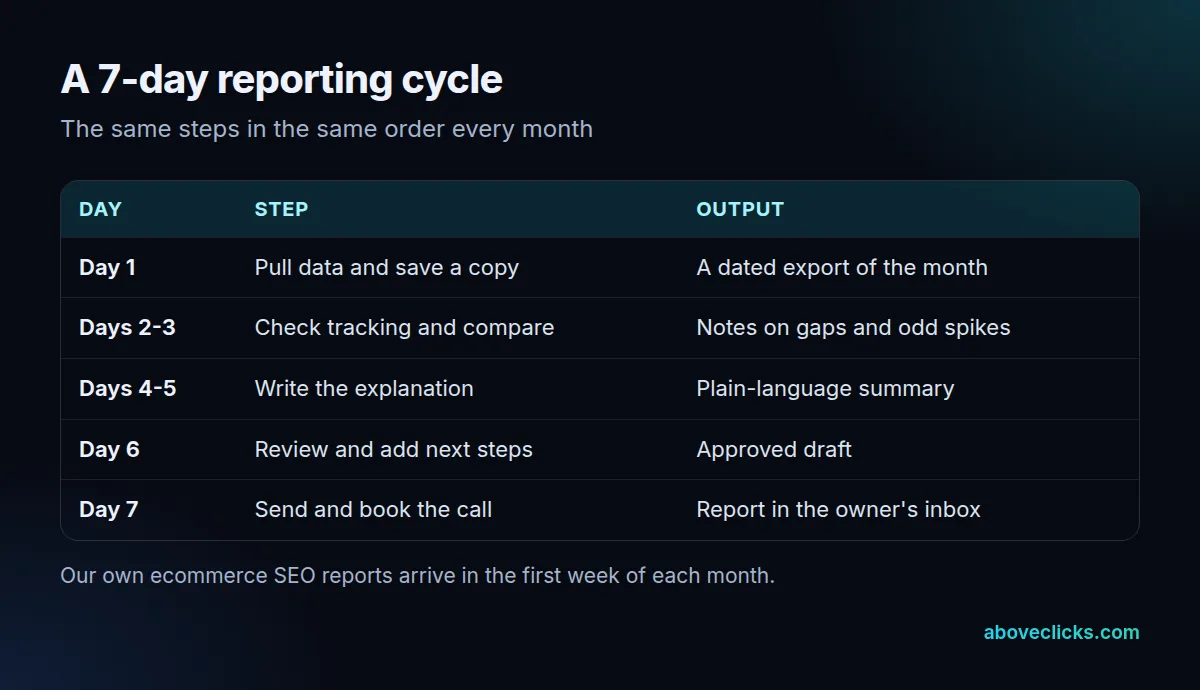
Day 1 is for pulling and saving, because the newest figures in Search Console can be preliminary and may change within hours. Pulling on the first day of the month, after the last day has settled, avoids a number that quietly changes after you have written about it.
Days 2 and 3 are for checks. Does the Analytics organic total move the way Search Console clicks do? Was the tracking tag live all month? Did anything outside the SEO work happen, such as a sale, a redesign or a core update? Google advises waiting at least a full week after a core update completes before analysing it, so a report that falls inside that week should say the picture is not final.
Days 4 and 5 are for the explanation, which is the part tools cannot do and the part that separates SEO monthly reporting from a data dump. Day 6 is a second read by someone who did not write it. Day 7 is delivery and a short call.
One calendar trap is worth a line in the process. February has 28 days and March has 31, so March can show about 11% more clicks with no change in performance at all. Compare clicks per day, or compare the month with the same month a year earlier, which has the same number of days apart from leap years. Ask the person who writes your report which of the two they use.
That is the rhythm we use for our own ecommerce SEO work: the first monthly report arrives after 30 days, and then each report lands in the first week of the month. Whoever you hire, ask for the day the report arrives, and hold them to it.
Which data should you save every month?
The month’s Performance export, the top queries table, indexing counts, organic orders or leads, a work log and outside events. Several of these tools only show a limited window, so a monthly copy is your own history.
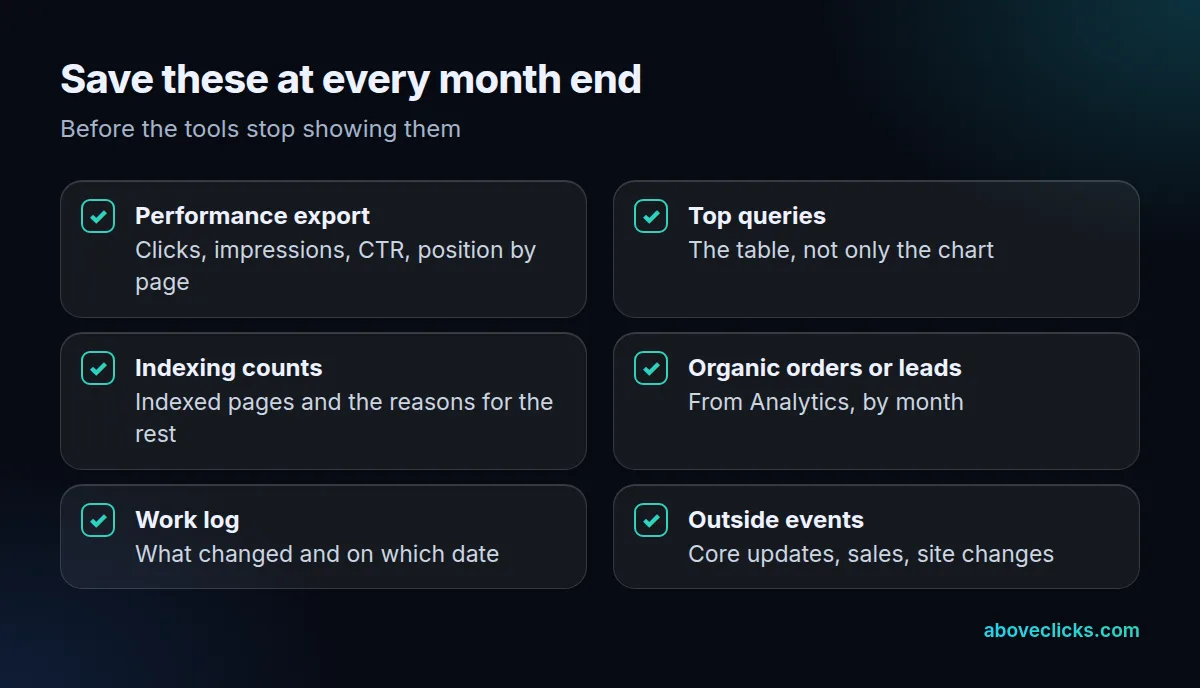
The limits are written down by Google. Its traffic-drop guide recommends setting the Performance report to the last 16 months to see yearly seasonality, and points to the Search Analytics API for anything longer. In Google Analytics, event-level data for explorations can be kept for 2 or 14 months, while standard aggregated reports are not affected by that setting. A comparison against the same month 18 months ago may therefore be impossible later unless you saved it.
There are two ways to save. The simple one is a monthly export to a spreadsheet or document, stored in a folder named by month. The stronger one is Search Console’s bulk data export, which sends a daily export of your performance data to BigQuery, covering everything except anonymized queries. Google notes in its setup guide that the data accumulates unless you set an expiration time, and that storage and query costs apply above a free level. A store with a small team usually needs only the first way: 12 exports a year, one per month, takes a few minutes each and leaves you with a complete year to compare at month 12.
Whichever you choose, keep the work log with the numbers, because SEO monthly reporting without dates cannot explain a dip. A dip next to “migrated 40 product pages on the 12th” means something; the same dip alone does not. If you want the charts to refresh themselves, Looker Studio dashboards can sit on top of the same sources.
What should an SEO monthly report template contain?
One summary, the results with their sources, the work log, orders or leads, and next steps, in the same layout every month. Keep the layout fixed and change only the figures and the words, so each seo monthly report can be read against the last.
A workable seo monthly report template has five blocks, and a good seo monthly report template never adds a sixth:
- Summary: three sentences on what moved, why, and what is next.
- Search results: clicks, impressions, CTR and average position, each against last month and the same month last year.
- Work log: dated items, such as “rewrote 6 collection page titles on the 9th”.
- Business results: organic orders or leads for the month, from Analytics.
- Next month: the planned work and what is waiting on you.
Two details keep every seo monthly report honest. Average position in the chart is that of the topmost result from your site, so a new page that ranks lower can pull the figure down while clicks rise. And Google’s Performance chart counts two results from the same site for one query as a single impression, so totals will not equal the sum of the table rows. Put one line in the template that tells readers this.
Here is how the layout handles one common confusion. A month with 1,000 impressions and 25 clicks has a CTR of 2.5%, because CTR is clicks divided by impressions. If a new page then adds 600 impressions and only 6 clicks, total impressions reach 1,600, clicks reach 31, and CTR falls to about 1.9% while clicks rose. The invented figures show why the template puts all three metrics side by side with a sentence of explanation; a lone CTR line would read as bad news.
The whole template should fit on 2 pages. If the owner cannot read it in 5 minutes, it will stop being read, and unread reporting is the same as no reporting.
For a template with real figures laid out, our sample report uses the same blocks, with illustrative numbers.
How do you check the SEO monthly reporting you receive?
Apply six questions to the page itself. A report that answers all six is usable; one that fails two or more is a sales document, and weak SEO monthly reporting is a reason to ask questions before the next invoice.
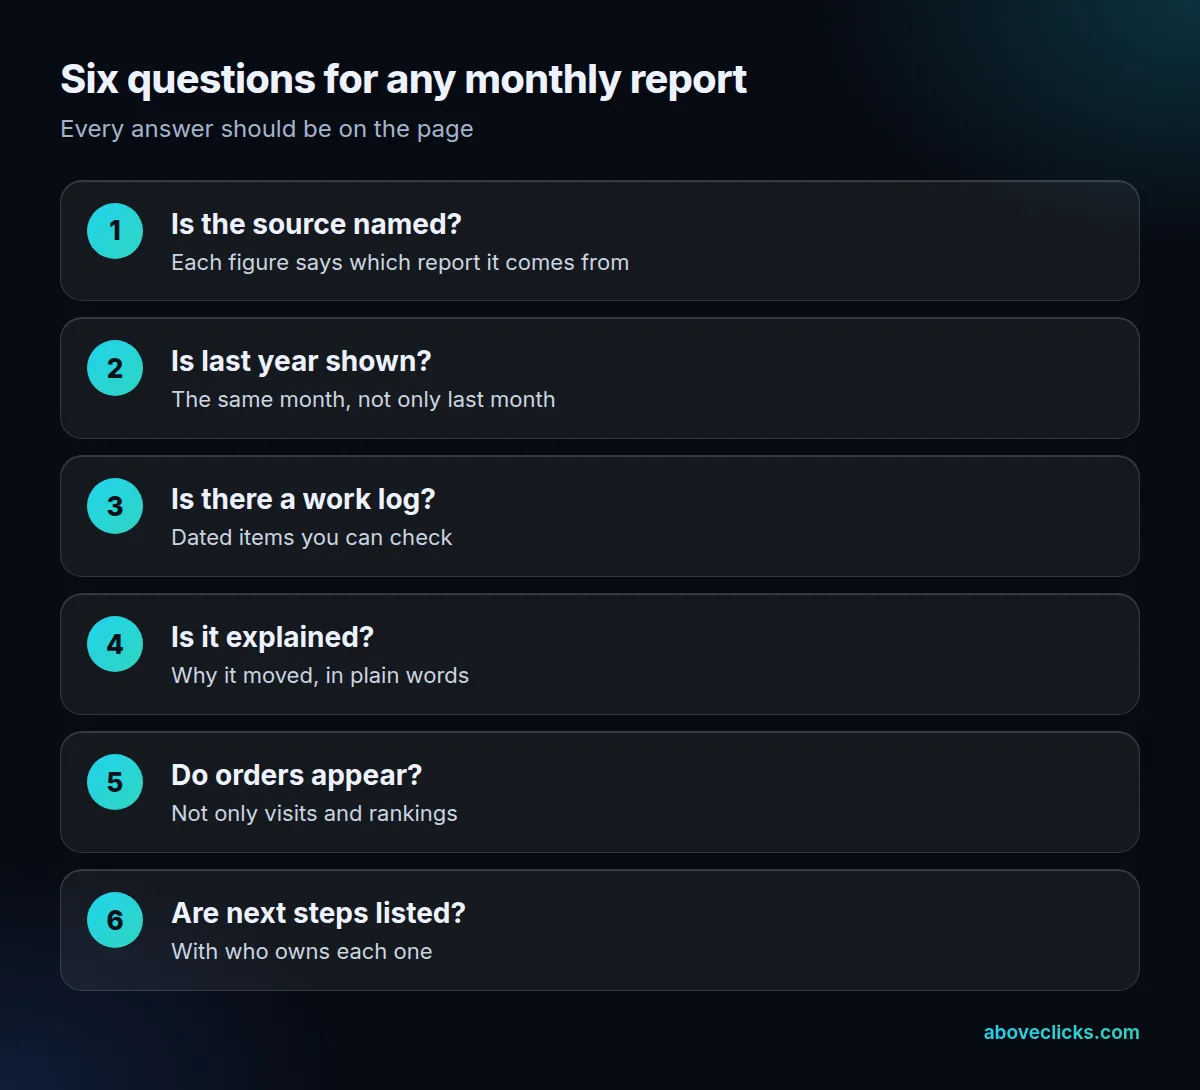
Here is a worked example of what the test catches. The figures are invented. A store’s report says organic clicks were 120 in the month. Search Console, opened by the owner for the same dates, shows 164. The difference could be a different date range, a different search type filter, or Analytics sessions reported as clicks. The first question settles it, because a report that names its source says which report and which filter each number comes from. Without that, the 44-click gap cannot be explained, and neither can the trend built on it.
Question 2 is the one most often missing. Without the same month last year, a seasonal store gets credit for a holiday rise and blame for a summer fall. Question 5 matters most for an owner reading SEO monthly reporting: rankings and visits are not revenue. A report with no orders or leads cannot say whether the SEO is paying back.
Score the report out of 6, one point per question, and keep the score from month to month. A report that scores 3 in month 1 and still scores 3 in month 4 is not improving, whatever its charts look like. Reports from a good agency usually reach 5 or 6 within the first 3 months, because the missing pieces are mostly setup: source labels, the saved history and the order tracking.
Ask for the answers in writing before month 3. If the agency cannot show the source for a figure, ask for read-only access to the accounts and open the numbers yourself; our free audit works the same way, with read-only access and a written report.