Results

Real numbers, or none at all.

We publish results only from our own reports and platform exports, with the timeframe and data source. Below: four headline numbers, how we publish them, galleries from Search Console, Google Ads and Meta Ads Manager, and three ecommerce marketing case studies with the report screenshots.

Headline results

Four numbers from our client work.

The first two come from the case studies below, with the platforms’ own reports. The other two are totals across client accounts we can’t show: those clients keep their data private, so no screenshots go with them.

  • 53.8x more organic clicks

    3,847 → 206,849 clicks for one jewelry store (Search Console, 28-day windows: December 2025 and September–October 2026).

  • $18.44M in online sales

    $18,444,401.31 in online net merchandise sales for one antique jewelry store, Nov 2021–Sep 2026, including a single $100,000 online sale (Sep 12, 2026).

  • Top 3 rankings for 1,000+ keywords

    Keywords that reached positions 1–3 in Google across our clients’ sites.

  • 50,000+ leads generated

    Leads generated for our clients.

Our rules

How we publish results.

  • From our own reports only

    Every number comes from our monthly reports or platform exports: Google Ads, Meta Ads Manager, GA4 or Search Console.

  • Timeframe and source on every number

    A result without dates and a data source isn’t a result. Each case lists both.

  • Anonymized by default

    Clients are described by industry and market (“US jewelry retailer”). We name a client or show a logo only with written permission.

Search Console

Organic search, from Search Console.

Eight client sites over the same 28 days (20 Sep to 17 Oct 2026), straight from Google Search Console’s Performance report for web search. Clients are anonymized, domains are hidden, and the screenshots are shown with their permission.

Google Search Console Performance report for an anonymized client site: 205K clicks, 12.8M impressions, 1.6% average CTR and average position 7.7 over 28 days, 20 September to 17 October 2026
205K clicks · 12.8M impressions · 1.6% CTR · position 7.7 (28 days)
Google Search Console Performance report for an anonymized client site: 152K clicks, 7.98M impressions, 1.9% average CTR and average position 7.9 over 28 days, 20 September to 17 October 2026
152K clicks · 7.98M impressions · 1.9% CTR · position 7.9 (28 days)
Google Search Console Performance report for an anonymized client site: 129K clicks, 9.2M impressions, 1.4% average CTR and average position 9.2 over 28 days, 20 September to 17 October 2026
129K clicks · 9.2M impressions · 1.4% CTR · position 9.2 (28 days)
Google Search Console Performance report for an anonymized client site: 104K clicks, 6.91M impressions, 1.5% average CTR and average position 8.4 over 28 days, 20 September to 17 October 2026
104K clicks · 6.91M impressions · 1.5% CTR · position 8.4 (28 days)
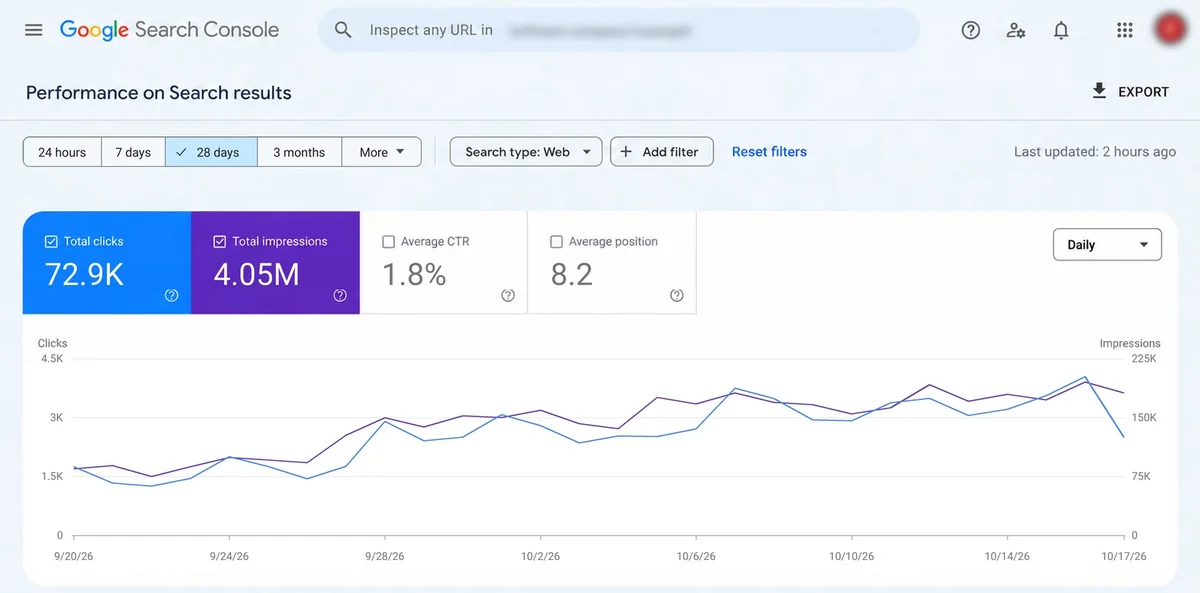
Google Search Console Performance report for an anonymized client site: 72.9K clicks, 4.05M impressions, 1.8% average CTR and average position 8.2 over 28 days, 20 September to 17 October 2026
72.9K clicks · 4.05M impressions · 1.8% CTR · position 8.2 (28 days)
Google Search Console Performance report for an anonymized client site: 51.8K clicks, 3.05M impressions, 1.7% average CTR and average position 8.6 over 28 days, 20 September to 17 October 2026
51.8K clicks · 3.05M impressions · 1.7% CTR · position 8.6 (28 days)
Google Search Console Performance report for an anonymized client site: 35.7K clicks, 2.75M impressions, 1.3% average CTR and average position 8.8 over 28 days, 20 September to 17 October 2026
35.7K clicks · 2.75M impressions · 1.3% CTR · position 8.8 (28 days)
Google Search Console Performance report for an anonymized client site: 24.8K clicks, 1.24M impressions, 2% average CTR and average position 8.9 over 28 days, 20 September to 17 October 2026
24.8K clicks · 1.24M impressions · 2% CTR · position 8.9 (28 days)

Meta Ads Manager

Paid social, from Ads Manager.

Three e-commerce clients over the same 28 days (20 Sep to 17 Oct 2026), straight from Meta Ads Manager’s campaign view. Purchase value and ROAS are as Meta reports them. Clients are anonymized, account names are hidden, and the screenshots are shown with their permission.

Meta Ads Manager campaign report for an anonymized apparel e-commerce client: 438 website purchases, $3,846.72 spent, $34,045.56 purchase conversion value and 8.85 purchase ROAS across 6 campaigns, 20 September to 17 October 2026
Apparel store: 438 purchases · 8.85 ROAS · $34K purchase value from $3.8K spend (28 days)
Meta Ads Manager campaign report for an anonymized home decor e-commerce client: 286 website purchases, $2,678.45 spent, $24,910.31 purchase conversion value and 9.30 purchase ROAS across 6 campaigns, 20 September to 17 October 2026
Home decor store: 286 purchases · 9.30 ROAS · $24.9K purchase value from $2.7K spend (28 days)
Meta Ads Manager campaign report for an anonymized skincare e-commerce client: 624 website purchases, $4,295.18 spent, $38,896.39 purchase conversion value and 9.06 purchase ROAS across 6 campaigns, 20 September to 17 October 2026
Skincare store: 624 purchases · 9.06 ROAS · $38.9K purchase value from $4.3K spend (28 days)

Case studies

Three stores, in full.

The headline numbers and galleries above are the short version. Below are three anonymized case studies: a jewelry store moved from a custom CMS to Shopify, an antique jewelry store we have worked with for almost five years, and four smaller stores. Each one lists the timeframe and data source, with the platforms’ own screenshots.

Case study

One jewelry store, three quarters in.

Snapshot, challenge, what we did, results with timeframe and source, the report screenshots and what’s next. The client is anonymized.

Case study

From a sprawling custom CMS to a focused Shopify store

  • 3,847 → 206,849Search Console clicks in 28 days
  • 2.41 → 8.76Meta Ads ROAS, Dec 2025 vs Sep 2026
  • 1.21 → 8.33Google Ads ROAS, Dec 2025 vs Sep 2026
  • 240 of 240tracked keywords in Google’s top 10, 86 in positions 1–3
Industry
Jewelry e-commerce: rings, necklaces, earrings and personalized gifts
Market
United States
Channels
SEO, Meta Ads, Google Ads
Platform
Custom CMS → Shopify (launched May 12, 2026, same domain)
Timeframe
January–December 2026 engagement, three quarters complete

The challenge

The store’s custom CMS exposed far more URLs than the business needed. The starting crawl discovered 52,684 URLs, and 47,948 of them were unwanted route variants: 40,178 faceted URLs, 5,638 tag indexes and 2,132 duplicate pagination variants. That is a crawl inventory, not a count of indexed pages; Search Console supplied the indexation warnings. Product pages competed with weaker variants. Google Ads held 19 legacy campaigns with overlapping names, fragmented budgets and incomplete purchase tracking, and only 4 delivered in the baseline month. Meta’s six sales campaigns reported incomplete purchase value, so marketing reports couldn’t be tied to orders.

What we did

  • Quarter one, measurement: one order-value specification in USD; Meta Pixel and Conversions API deduplicated with matching event IDs; one primary Google Ads purchase action with transaction IDs and dynamic values, so a duplicate GA4 import never became a second primary action. Test orders covered discounts, currency, failed checkouts and repeat events.
  • Quarter one, the URL map: products, useful collections, editorial content and route variants sorted, using revenue pages, external links and search landing pages. Pages with distinct useful content stayed discoverable; genuine duplicates were consolidated, not all redirected to the homepage.
  • Quarter two, the migration: Shopify launched on May 12, 2026 on the same domain, with 4,736 canonical URLs (3,874 product pages, 286 collections, 324 guides and 252 information pages). Equivalent old pages got permanent redirects, removed content without a successor returns a removal response, and internal links, canonicals, sitemaps, structured data and image references moved together.
  • Quarter two, the ad accounts: Google Ads rebuilt around four delivering campaigns (two Performance Max, one Shopping, branded Search) on a consistent product feed; Meta organized around prospecting, catalogue sales, new collections and returning shoppers.
  • Quarter three, growth: collection copy, product information, internal links and buying guides improved against a fixed list of 240 keywords, and paid budgets grew only after purchase measurement was repaired.

Results

  • Search Console, web search, 28 days each (Dec 4–31, 2025 vs Sep 20–Oct 17, 2026): clicks 3,847 → 206,849, impressions 447,913 → 10,247,981, CTR 0.9% → 2% and average position 22.8 → 7.9.
  • Ahrefs Rank Tracker, Google US desktop, October 17, 2026: all 240 tracked keywords in the top 10, 86 in positions 1–3 and 154 in positions 4–10. This is the fixed tracked set, not every query the store appears for.
  • Meta Ads (Dec 2–31, 2025 vs Sep 1–30, 2026): ROAS 2.41 → 8.76 on spend of $9,847.63 → $48,736.29; purchases 102 → 1,897; cost per purchase $96.55 → $25.69.
  • Google Ads (same periods): ROAS 1.21 → 8.33 on spend of $11,483.79 → $39,847.63; purchases 62 → 1,473; cost per purchase $185.22 → $27.05.
  • Site size: 52,684 discovered URLs → 4,736 canonical Shopify URLs, about 91% smaller.

Data source

Google Search Console (Performance report, web search), Ahrefs Rank Tracker, Google Ads and Meta Ads Manager campaign reports. Money in USD; ROAS is attributed merchandise value divided by ad spend, not profit.

Screenshot (redacted)

Six report screenshots, before and after: Search Console, Google Ads and Meta Ads. Account names are hidden.

What’s next

The fourth and final quarter of the January–December 2026 engagement.

How to read these numbers: the December baseline had incomplete purchase reporting, and both the tracking repair and the bigger budgets shape the September reports, so the ROAS change is reported attributed performance, not a like-for-like comparison of profitability. Meta and Google can both claim the same order (427 September orders were counted by both), so their purchases and values can’t be added up as store revenue. The two Search Console periods differ in season and catalogue, so they don’t isolate the migration as the only cause.

The reports

Before and after, in the platforms’ own reports.

The six screenshots behind the case study above: Search Console (28 days each), Google Ads and Meta Ads Manager (30 days each), December 2025 against September 2026. Account names and the site address are hidden; campaign names are generic descriptors.

Search Console: 28 days, before and after

Google Search Console performance report for an anonymized US jewelry store, web search, December 4–31, 2025: 3.85K total clicks, 448K total impressions, 0.9% average CTR and average position 22.8
Before, Dec 4–31, 2025: 3.85K clicks, position 22.8.
Google Search Console performance report for an anonymized US jewelry store, web search, September 20 to October 17, 2026: 207K total clicks, 10.2M total impressions, 2% average CTR and average position 7.9
After, Sep 20–Oct 17, 2026: 207K clicks, position 7.9.

Google Ads: December 2025 and September 2026

Google Ads campaigns report for an anonymized US jewelry store, December 2–31, 2025, four delivering Search campaigns: $11,483.79 cost, 13,847.29 conversion value, 62 conversions and 1.21 conversion value per cost
Before, Dec 2–31, 2025: 62 conversions, ROAS 1.21.
Google Ads campaigns report for an anonymized US jewelry store, September 1–30, 2026, two Performance Max, one Shopping and one brand Search campaign: $39,847.63 cost, 331,948.27 conversion value, 1,473 conversions and 8.33 conversion value per cost
After, Sep 1–30, 2026: 1,473 conversions, ROAS 8.33.

Meta Ads: December 2025 and September 2026

Meta Ads Manager campaigns report for an anonymized US jewelry store, December 2–31, 2025, six legacy campaigns: 102 website purchases, $9,847.63 spent, $23,749.84 purchase conversion value and 2.41 purchase ROAS
Before, Dec 2–31, 2025: 102 purchases, ROAS 2.41.
Meta Ads Manager campaigns report for an anonymized US jewelry store, September 1–30, 2026, six sales campaigns: 1,897 website purchases, $48,736.29 spent, $426,783.46 purchase conversion value and 8.76 purchase ROAS
After, Sep 1–30, 2026: 1,897 purchases, ROAS 8.76.

Case study

One antique jewelry store, almost five years in.

Snapshot, challenge, what we did, results with timeframe and source, the report screenshots and what’s next. The client is anonymized.

Case study

From Wix to Shopify: a long-term antique jewelry engagement

  • $18.44M$18,444,401.31 in online net merchandise sales, Nov 2021–Sep 2026, Wix and Shopify
  • 4,283 → 118,763Search Console clicks in 28 days, 2025 vs 2026
  • 180 of 180tracked keywords in Google’s top 10, all 48 priority targets in the top 3
  • $100,000one Victorian necklace, sold online on September 12, 2026
Industry
Antique jewelry e-commerce: period rings, lockets, brooches and diamond pieces
Market
United States
Channels
SEO, Meta Ads, Google Ads
Platform
Wix → Shopify (launched September 17, 2024, same domain)
Timeframe
November 2021–present, ongoing (almost five years)

The challenge

The store sells antique jewelry to US buyers: period rings, lockets, brooches and diamond pieces. Buyers search for a particular era, stone, metal or item rather than a broad category, often over repeated visits, so a generic collection page or a broad audience isn’t enough for someone looking for one piece at a five-figure price. Unique pieces also sell, and once one does, the product feed and ad eligibility have to reflect it. The store needed useful historical product information for search, clear condition and provenance details for buyers, and a reliable way to tie a paid order to its purchase event and marketing journey. The starting point, on Wix in November 2021: 5 paid online orders and $55,090.69 in net merchandise sales; 1,187 clicks and 164,923 impressions in the archived 28-day SEO window; 14 of the 180 tracked keywords in the top 10, and none of the 48 priority targets in the top 3.

What we did

  • From November 2021, on Wix: a consistent product taxonomy, better collection and product information, audiences built around collectors and period jewelry, and one measurement vocabulary across the store and the ad accounts.
  • September 17, 2024, the Wix → Shopify move on the same domain: 642 product pages, 74 collections, 218 editorial pages and 34 service and information pages carried into 968 canonical URLs, keeping product identifiers, item descriptions, image references, metadata and useful customer records. Historical Wix orders stayed in the reporting archive, so post-launch Shopify sales never duplicate legacy turnover.
  • The redirect map: a reviewed inventory of 1,126 old paths gave 1,082 permanent redirects and 44 retired routes with no equivalent page. Products, collections and editorial pages were mapped directly, and internal links, canonicals, structured data and sitemaps were updated together. Nothing was blanket-redirected to the homepage.
  • Tracking rebuilt for the launch: one primary Google purchase action, GA4 purchase reporting, and Meta Pixel plus Conversions API, all on the same order identifiers and merchandise values. Browser and server purchase events share identifiers for deduplication; currency, discounts, tax and shipping are handled explicitly (ad-platform purchase value excludes shipping and tax), and checkout paths and event delivery were checked before and after launch.
  • 2025–2026, SEO: technical checks plus batch metadata optimization with individual review (period, item type, material, stone), product and collection copy, internal links and buying guides built around specific search intent. Sold pieces with lasting information are assessed one by one rather than deleted, and in-stock availability and the correct used condition go into the product feed.
  • 2025–2026, paid media: Meta audiences for antique collectors, catalogue discovery, new acquisitions, returning collectors and retargeting; Google Ads on Performance Max, Shopping and branded Search, with product groups and feed labels so sold pieces leave active promotion. Budgets follow purchase value and ROAS alongside the cost of a completed high-ticket order.

Results

  • Migration continuity, separate 28-day windows: organic clicks 3,186 (Aug 20–Sep 16, 2024) → 3,094 (Sep 18–Oct 15, 2024), 2.89% lower in the first window after launch, then 3,372 (Oct 16–Nov 12, 2024). Paid online orders 7 → 15 and net merchandise sales $90,259.70 → $226,447.44 in the first two windows; changing inventory and ongoing marketing also shape those sales.
  • Search Console, web search, 28 days each (Sep 20–Oct 17, 2025 vs Sep 20–Oct 17, 2026): clicks 4,283 → 118,763, impressions 497,623 → 5,647,813, CTR 0.9% → 2.1% and average position 18.7 → 4.6.
  • Ahrefs Rank Tracker, Google US desktop, October 17, 2026: all 48 priority targets in the top 3, and all 180 tracked keywords in the top 10 (72 in positions 1–3, 108 in 4–10). This is the fixed tracked set, not every query the store appears for.
  • Meta Ads (Sep 1–30, 2025 vs Sep 1–30, 2026): ROAS 5.02 → 8.90 on spend of $18,479.23 → $29,736.42; purchases 8 → 14; attributed merchandise value $92,738.51 → $264,738.67; cost per purchase $2,309.90 → $2,124.03.
  • Google Ads (same periods): ROAS 5.76 → 8.92 on spend of $26,873.54 → $47,839.16; purchases 11 → 19; attributed merchandise value $154,873.26 → $426,839.73; cost per purchase $2,443.05 → $2,517.85.
  • Online net merchandise sales, November 2021–September 2026, Wix and Shopify together: $18,444,401.31 from 1,156 orders. On Shopify, calendar 2025 brought $5,764,382.16 (342 orders) and January–September 2026 brought $8,437,926.48 (492 orders). The two periods differ in length, so they aren’t a like-for-like growth rate.
  • The $100,000 sale: on September 12, 2026, a Victorian old-cut diamond necklace sold online at a full item price of $100,000.00, with no discount or shipping charge. Tax of $8,250.00 made a captured payment of $108,250.00, and the piece was fulfilled on September 14. The recorded journey ran 12 sessions over 41 days, from a first visit via organic Google search to a last recorded source of Google Ads branded Search.

Data source

Google Search Console (Performance report, web search), Ahrefs Rank Tracker, Google Ads and Meta Ads Manager campaign reports, Shopify Analytics and the store’s order ledger across Wix and Shopify. Money in USD; ROAS is attributed merchandise value divided by ad spend, not profit.

Screenshot (redacted)

Ten report screenshots: Search Console, Meta Ads and Google Ads before and after, three Shopify sales reports and the $100,000 order. Store, account and customer details are hidden.

What’s next

Ongoing SEO, Meta Ads and Google Ads work; the engagement continues.

How to read these numbers: the Search Console windows show the later continuation (2025 vs 2026), not the first month of work or the migration cutover. In September 2026, Meta reported 14 attributed orders and Google 19, but 5 order IDs were claimed by both, so that’s 28 distinct ad-attributed orders worth $598,828.59, not 33; the other 36 of the store’s 64 September orders weren’t attributed to either platform. Ad-platform purchase values exclude tax and shipping, so the $100,000 order counts as $100,000.00 in Google Ads, once in Shopify, and not at all in Meta.

The reports

Search, ads and sales, in the platforms’ own reports.

The ten screenshots behind the case study above: Search Console (28 days each, September 20–October 17, 2025 and 2026), Meta Ads Manager and Google Ads (September 2025 and September 2026), three Shopify sales reports and the $100,000 order. Store, account and customer details are hidden; campaign names are generic descriptors.

Search Console: 28 days, before and after

Google Search Console performance report for an anonymized US antique jewelry store, web search, September 20 to October 17, 2025: 4.28K total clicks, 498K total impressions, 0.9% average CTR and average position 18.7
Search Console — Sep 20–Oct 17, 2025: 4.28K clicks, position 18.7.
Google Search Console performance report for an anonymized US antique jewelry store, web search, September 20 to October 17, 2026: 119K total clicks, 5.65M total impressions, 2.1% average CTR and average position 4.6
Search Console — Sep 20–Oct 17, 2026: 119K clicks, position 4.6.

Meta Ads: September 2025 and September 2026

Meta Ads Manager campaigns report for an anonymized US antique jewelry store, September 1–30, 2025, six sales campaigns: 8 website purchases, $18,479.23 spent, $92,738.51 purchase conversion value and 5.02 purchase ROAS
Meta Ads — September 2025: 8 purchases, ROAS 5.02.
Meta Ads Manager campaigns report for an anonymized US antique jewelry store, September 1–30, 2026, six sales campaigns: 14 website purchases, $29,736.42 spent, $264,738.67 purchase conversion value and 8.90 purchase ROAS
Meta Ads — September 2026: 14 purchases, ROAS 8.90.

Google Ads: September 2025 and September 2026

Google Ads campaigns report for an anonymized US antique jewelry store, September 1–30, 2025, two Performance Max, one Shopping and one brand Search campaign: $26,873.54 cost, 154,873.26 conversion value, 11 conversions and 5.76 conversion value per cost
Google Ads — September 2025: 11 conversions, ROAS 5.76.
Google Ads campaigns report for an anonymized US antique jewelry store, September 1–30, 2026, two Performance Max, one Shopping and one brand Search campaign: $47,839.16 cost, 426,839.73 conversion value, 19 conversions and 8.92 conversion value per cost
Google Ads — September 2026: 19 conversions, ROAS 8.92.

Shopify sales: 2025, January–September 2026 and September 2026

Shopify Analytics dashboard for an anonymized US antique jewelry store, January 1 to December 31, 2025, in USD: $6,071,871.35 total sales, $5,764,382.16 net sales, 342 orders and $17,099.73 average order value
Shopify sales — calendar 2025: $5,764,382.16 net sales, 342 orders.
Shopify Analytics dashboard for an anonymized US antique jewelry store, January 1 to September 30, 2026, in USD: $8,889,691.57 total sales, $8,437,926.48 net sales, 492 orders and $17,393.72 average order value
Shopify sales — January–September 2026: $8,437,926.48 net sales, 492 orders.
Shopify Analytics dashboard for an anonymized US antique jewelry store, September 1–30, 2026, in USD: $1,496,813.87 total sales, $1,420,659.35 net sales, 64 orders and $22,352.02 average order value
Shopify sales — September 2026: $1,420,659.35 net sales, 64 orders.

The $100,000 order

Shopify order detail for an anonymized US antique jewelry store, placed September 12, 2026: one Victorian old-cut diamond necklace at $100,000.00, no shipping charge, $8,250.00 tax and a $108,250.00 total, paid and fulfilled September 14; conversion summary 12 sessions over 41 days, source Google Ads, first session Google search. Order number, customer and payment details are hidden
The $100,000 order — paid and fulfilled: $108,250.00 with tax, fulfilled Sep 14, 2026.

Case study

Four smaller stores, four separate results.

Snapshot, challenge, what we did, results with timeframe and source, the report screenshots and what’s next. An anonymous composite: the stores are anonymized and each store’s figures stay separate.

Case study · four-store composite

Smaller stores, focused fixes and clearer numbers

  • 37 → 4Store A: “linen storage basket with lid”, one of 24 tracked terms
  • 28 → 3Store B: “fragrance free hand balm”, one of 18 tracked terms
  • 42 → 5Store C: “waterproof dog long line”, one of 22 tracked terms
  • 31 → 8Store D: “loose leaf breakfast tea tin”, one of 26 tracked terms
Format
Anonymous composite of four independent stores; each store’s results stay separate
Stores
Store A home storage, Store B personal care, Store C pet accessories, Store D specialty tea
Market
United States
Channels
Technical SEO, product feeds, purchase tracking, owner training
Timeframe
10–12-week projects between June 29 and September 30, 2026

The challenge

Four smaller US e-commerce stores needed practical answers: why useful pages were not appearing on Google, which product-data problems were blocking visibility, and whether their purchase reports could be trusted. They needed a focused project with a clear handover. The work combined technical audits, prioritized SEO fixes, product-feed corrections, purchase tracking and owner tutorials, over 10–12 weeks per store. This case brings those projects together as an anonymous composite: each store keeps its own dates, keyword list, ad account, product catalog and order totals, and its results are never added to another store’s.

What we did

  • Store A, home storage (June 29–September 20, 2026, 12 weeks): collection pages were excluded by inherited noindex rules, internal links favored faceted URLs, and purchase tags fired more than once. We removed the inherited noindex rules from eligible collections, consolidated filter URLs, repaired collection links, refreshed titles and product data, and deduplicated purchase reporting.
  • Store B, personal care (July 21–September 28, 2026, 10 weeks): product variants competed with the main product pages, titles were repeated across categories, and the reported purchase value was a fixed amount. We aligned variant canonicals, rewrote product and collection metadata, clarified product attributes without unsupported health claims, and mapped dynamic order values and currency.
  • Store C, pet accessories (July 6–September 27, 2026, 12 weeks): the sitemap pointed to redirected products, collection links were shallow, and shopping listings had price and availability mismatches. We rebuilt the sitemap around live canonical products, fixed collection navigation and broken product links, synchronized price and availability, and checked browser/server purchase deduplication.
  • Store D, specialty tea (July 23–September 30, 2026, 10 weeks): duplicate tag pages diluted the collections, descriptions were thin, and checkout self-referrals made the acquisition reports difficult to read. We consolidated the tag URLs, expanded useful collection copy and internal links, fixed checkout referral handling, and connected product identifiers consistently across the feed and purchase events.
  • Tracking, every store: GA4 e-commerce events with purchase marked as a key event, dynamic transaction IDs, USD currency and values, and matching item identifiers. The native Google purchase action stays primary and the GA4 purchase import secondary; Meta browser and server Purchase events share an order-based event ID. That prevents duplicate primary purchase actions and duplicate browser/server purchases.
  • Handover, every store: a prioritized maintenance list, event-checking instructions and a reporting walkthrough that teaches the owner to compare equal periods, check feed issues, investigate a purchase event and tell sales, attribution and profit apart.

Results

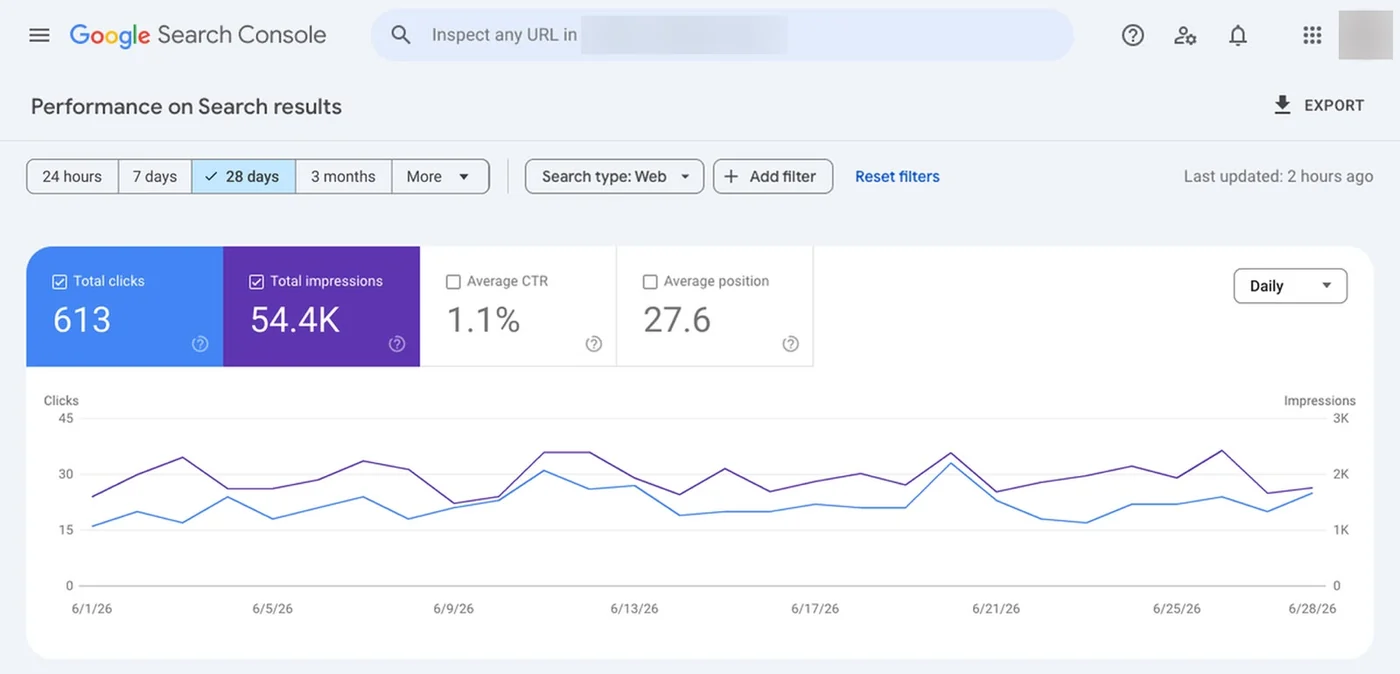
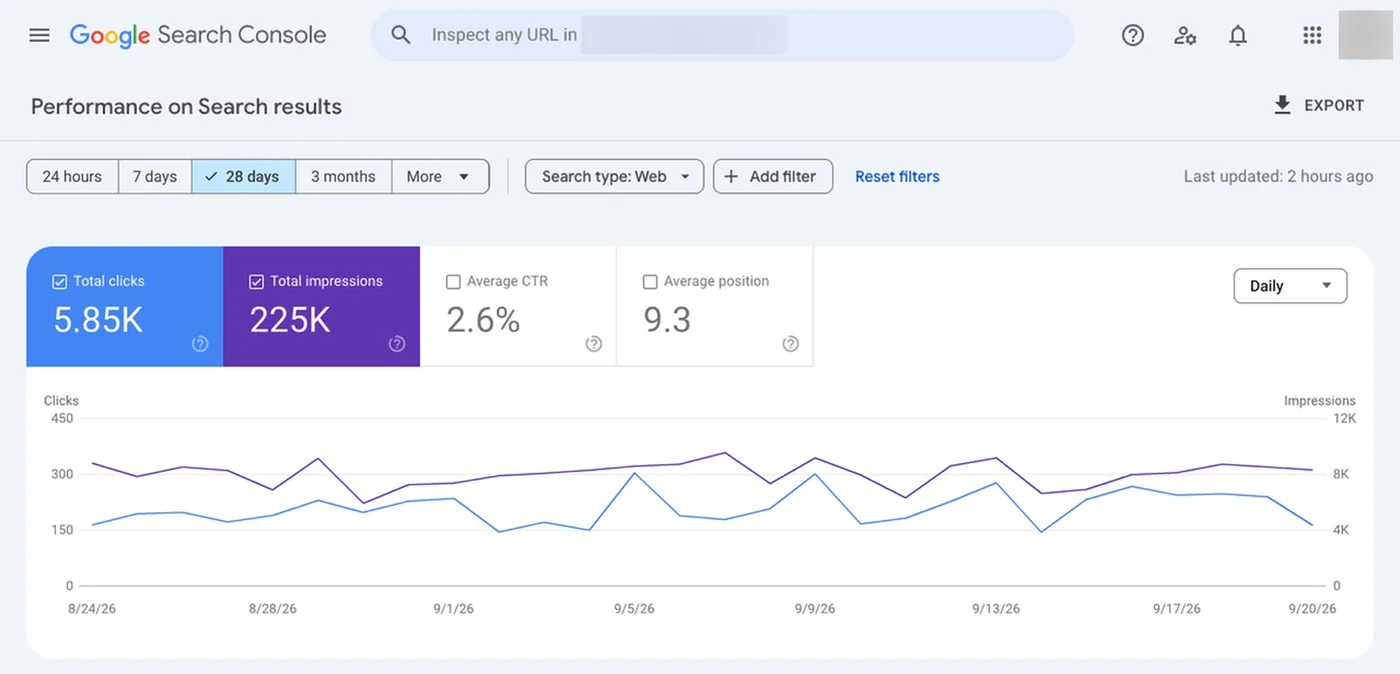
  • Store A, search: Search Console clicks 613 → 5,847, impressions 54,387 → 224,879, CTR 1.1% → 2.6% and average position 27.6 → 9.3 (28 days each: June 1–28 vs August 24–September 20, 2026). “linen storage basket with lid” moved 37 → 4; of the 24 tracked terms, 4 are in the top 3, 5 in positions 4–5, 8 in 6–10 and 7 outside the top 10.
  • Store A, closing window (August 24–September 20, 2026): Google Ads $562.83 spend, 3,002 clicks, $0.19 CPC, 73 purchases worth $4,519.27, $7.71 per purchase, 8.03× ROAS; Meta $493.16 spend, 3,080 link clicks, $0.16 CPC, 61 purchases worth $3,906.84, $8.08 per purchase, 7.92× ROAS. The store’s ledger shows 156 unique paid orders and $9,764.83 in net merchandise sales (AOV $62.60); 17 orders ($1,084.79) were credited by both platforms, leaving 117 unique ad-attributed orders ($7,341.32) and 39 other orders ($2,423.51). Merchant Center: 173 → 243 of 248 products approved, with 3 limited and 2 under review left as owner follow-ups.
  • Store B, search: Search Console clicks 428 → 3,961, impressions 46,973 → 156,842, CTR 0.9% → 2.5% and average position 32.4 → 10.1 (28 days each: June 23–July 20 vs September 1–28, 2026). “fragrance free hand balm” moved 28 → 3; of the 18 tracked terms, 3 are in the top 3, 2 in positions 4–5, 6 in 6–10 and 7 outside the top 10.
  • Store B, closing window (September 1–28, 2026): Google Ads $372.61 spend, 1,973 clicks, $0.19 CPC, 81 purchases worth $3,064.97, $4.60 per purchase, 8.23× ROAS; Meta $438.42 spend, 2,733 link clicks, $0.16 CPC, 93 purchases worth $3,498.76, $4.71 per purchase, 7.98× ROAS. The store’s ledger shows 203 unique paid orders and $7,624.98 in net merchandise sales (AOV $37.56); 21 orders ($814.79) were credited by both platforms, leaving 153 unique ad-attributed orders ($5,748.94) and 50 other orders ($1,876.04). Merchant Center: 93 → 142 of 144 products approved, with 1 limited and 1 under review left as owner follow-ups.
  • Store C, search: Search Console clicks 971 → 8,243, impressions 83,729 → 306,974, CTR 1.2% → 2.7% and average position 24.8 → 8.6 (28 days each: June 8–July 5 vs August 31–September 27, 2026). “waterproof dog long line” moved 42 → 5; of the 22 tracked terms, 5 are in the top 3, 4 in positions 4–5, 8 in 6–10 and 5 outside the top 10.
  • Store C, closing window (August 31–September 27, 2026): Google Ads $834.92 spend, 4,406 clicks, $0.19 CPC, 89 purchases worth $6,964.83, $9.38 per purchase, 8.34× ROAS; Meta $623.84 spend, 3,886 link clicks, $0.16 CPC, 64 purchases worth $5,039.27, $9.75 per purchase, 8.08× ROAS. The store’s ledger shows 184 unique paid orders and $14,367.85 in net merchandise sales (AOV $78.09); 19 orders ($1,526.48) were credited by both platforms, leaving 134 unique ad-attributed orders ($10,477.62) and 50 other orders ($3,890.23). Merchant Center: 118 → 183 of 186 products approved, with 2 limited and 1 under review left as owner follow-ups.
  • Store D, search: Search Console clicks 319 → 2,749, impressions 35,241 → 118,623, CTR 0.9% → 2.3% and average position 35.2 → 11.4 (28 days each: June 25–July 22 vs September 3–30, 2026). “loose leaf breakfast tea tin” moved 31 → 8; of the 26 tracked terms, 2 are in the top 3, 4 in positions 4–5, 9 in 6–10 and 11 outside the top 10.
  • Store D, closing window (September 3–30, 2026): Google Ads $317.94 spend, 1,634 clicks, $0.19 CPC, 52 purchases worth $2,564.83, $6.11 per purchase, 8.07× ROAS; Meta $294.83 spend, 1,843 link clicks, $0.16 CPC, 48 purchases worth $2,356.47, $6.14 per purchase, 7.99× ROAS. The store’s ledger shows 127 unique paid orders and $6,147.93 in net merchandise sales (AOV $48.41); 13 orders ($654.78) were credited by both platforms, leaving 87 unique ad-attributed orders ($4,266.52) and 40 other orders ($1,881.41). Merchant Center: 66 → 95 of 96 products approved, with 1 limited left as an owner follow-up.

Data source

Google Search Console (Performance report, web search, property level), Ahrefs Rank Tracker (Google US desktop, a fixed keyword list per store), Google Ads and Meta Ads Manager campaign reports, Google Merchant Center product status, GA4 event settings and each store’s order ledger. Money in USD; ROAS is attributed purchase value divided by ad spend, not profit.

Screenshot (redacted)

Twenty-four report screenshots, six per store: Search Console before and after, Google Ads, Meta Ads, Merchant Center and the GA4 events setup. Store, account and property names are hidden.

What’s next

The projects are complete. Each owner keeps a prioritized maintenance list, and the follow-up list covers the remaining limited and newly reviewed products.

How to read these numbers: this is a composite of four separate stores, so each store’s figures stand alone and are never added together. The ad reports cover each store’s closing 28-day window only; they are closing-period results, and no paid before/after improvement is claimed. Meta CPC uses link clicks and Google CPC uses all clicks; purchase values exclude tax and shipping, and ROAS doesn’t deduct product, fulfillment or operating costs. A tracked keyword position is not the same measure as a Search Console property average, which covers a broader query and device mix. Merchant Center approval describes product eligibility; it doesn’t set a ranking or promise impressions. The setup screenshots show configuration; the order ledgers reconcile the closing purchase totals.

The reports

Four stores, six reports each.

The 24 screenshots behind the case study above, grouped by store and never combined: Search Console before and after (28 days each), then Google Ads, Meta Ads and Merchant Center for the store’s closing 28-day window, and the GA4 events setup. Store, account and property names are hidden; campaign names are generic descriptors.

Store A — home storage, project June 29–September 20, 2026 (12 weeks)

Google Search Console performance report for Store A, an anonymized US home storage store, web search, before the project, June 1 to 28, 2026: 613 total clicks, 54,387 impressions, 1.1% average CTR and average position 27.6
Store A — home storage · Search Console, before: Jun 1–28, 2026. 613 clicks, position 27.6.
Google Search Console performance report for Store A, an anonymized US home storage store, web search, after the project, August 24 to September 20, 2026: 5,847 total clicks, 224,879 impressions, 2.6% average CTR and average position 9.3
Store A — home storage · Search Console, after: Aug 24–Sep 20, 2026. 5,847 clicks, position 9.3.
Google Ads campaigns report for Store A, an anonymized US home storage store, closing window August 24 to September 20, 2026, Performance Max, Shopping and brand Search campaigns: $562.83 cost, 3,002 clicks, 73 conversions, 4,519.27 conversion value and 8.03 conversion value per cost
Store A — home storage · Google Ads, Aug 24–Sep 20, 2026 (closing window): 73 conversions, ROAS 8.03.
Meta Ads Manager campaigns report for Store A, an anonymized US home storage store, closing window August 24 to September 20, 2026, sales campaigns for broad prospecting, the product catalogue and retargeting: 61 website purchases, $493.16 spent, $3,906.84 purchase conversion value, 7.92 purchase ROAS and 3,080 link clicks
Store A — home storage · Meta Ads, Aug 24–Sep 20, 2026 (closing window): 61 purchases, ROAS 7.92.
Google Merchant Center product status for Store A, an anonymized US home storage store, August 24 to September 20, 2026: 248 products, 243 approved, 3 limited, 0 not approved and 2 under review; the product list shows the linen storage basket with lid approved and showing on Google
Store A — home storage · Merchant Center, Aug 24–Sep 20, 2026: 243 of 248 products approved.
Google Analytics 4 events screen for Store A, an anonymized US home storage store at handover: the e-commerce event set from view_item and add_to_cart to begin_checkout, add_shipping_info and purchase, with purchase marked as a key event. Property name hidden
Store A — home storage · GA4 events setup at handover: purchase marked as a key event.

Store B — personal care, project July 21–September 28, 2026 (10 weeks)

Google Search Console performance report for Store B, an anonymized US personal care store, web search, before the project, June 23 to July 20, 2026: 428 total clicks, 46,973 impressions, 0.9% average CTR and average position 32.4
Store B — personal care · Search Console, before: Jun 23–Jul 20, 2026. 428 clicks, position 32.4.
Google Search Console performance report for Store B, an anonymized US personal care store, web search, after the project, September 1 to 28, 2026: 3,961 total clicks, 156,842 impressions, 2.5% average CTR and average position 10.1
Store B — personal care · Search Console, after: Sep 1–28, 2026. 3,961 clicks, position 10.1.
Google Ads campaigns report for Store B, an anonymized US personal care store, closing window September 1 to 28, 2026, Performance Max, Shopping and brand Search campaigns: $372.61 cost, 1,973 clicks, 81 conversions, 3,064.97 conversion value and 8.23 conversion value per cost
Store B — personal care · Google Ads, Sep 1–28, 2026 (closing window): 81 conversions, ROAS 8.23.
Meta Ads Manager campaigns report for Store B, an anonymized US personal care store, closing window September 1 to 28, 2026, sales campaigns for broad prospecting, the product catalogue and retargeting: 93 website purchases, $438.42 spent, $3,498.76 purchase conversion value, 7.98 purchase ROAS and 2,733 link clicks
Store B — personal care · Meta Ads, Sep 1–28, 2026 (closing window): 93 purchases, ROAS 7.98.
Google Merchant Center product status for Store B, an anonymized US personal care store, September 1 to 28, 2026: 144 products, 142 approved, 1 limited, 0 not approved and 1 under review; the product list shows the fragrance-free hand balm approved and showing on Google
Store B — personal care · Merchant Center, Sep 1–28, 2026: 142 of 144 products approved.
Google Analytics 4 events screen for Store B, an anonymized US personal care store at handover: the e-commerce event set from view_item and add_to_cart to begin_checkout, add_shipping_info and purchase, with purchase marked as a key event. Property name hidden
Store B — personal care · GA4 events setup at handover: purchase marked as a key event.

Store C — pet accessories, project July 6–September 27, 2026 (12 weeks)

Google Search Console performance report for Store C, an anonymized US pet accessories store, web search, before the project, June 8 to July 5, 2026: 971 total clicks, 83,729 impressions, 1.2% average CTR and average position 24.8
Store C — pet accessories · Search Console, before: Jun 8–Jul 5, 2026. 971 clicks, position 24.8.
Google Search Console performance report for Store C, an anonymized US pet accessories store, web search, after the project, August 31 to September 27, 2026: 8,243 total clicks, 306,974 impressions, 2.7% average CTR and average position 8.6
Store C — pet accessories · Search Console, after: Aug 31–Sep 27, 2026. 8,243 clicks, position 8.6.
Google Ads campaigns report for Store C, an anonymized US pet accessories store, closing window August 31 to September 27, 2026, Performance Max, Shopping and brand Search campaigns: $834.92 cost, 4,406 clicks, 89 conversions, 6,964.83 conversion value and 8.34 conversion value per cost
Store C — pet accessories · Google Ads, Aug 31–Sep 27, 2026 (closing window): 89 conversions, ROAS 8.34.
Meta Ads Manager campaigns report for Store C, an anonymized US pet accessories store, closing window August 31 to September 27, 2026, sales campaigns for broad prospecting, the product catalogue and retargeting: 64 website purchases, $623.84 spent, $5,039.27 purchase conversion value, 8.08 purchase ROAS and 3,886 link clicks
Store C — pet accessories · Meta Ads, Aug 31–Sep 27, 2026 (closing window): 64 purchases, ROAS 8.08.
Google Merchant Center product status for Store C, an anonymized US pet accessories store, August 31 to September 27, 2026: 186 products, 183 approved, 2 limited, 0 not approved and 1 under review; the product list shows the waterproof dog long line approved and showing on Google
Store C — pet accessories · Merchant Center, Aug 31–Sep 27, 2026: 183 of 186 products approved.
Google Analytics 4 events screen for Store C, an anonymized US pet accessories store at handover: the e-commerce event set from view_item and add_to_cart to begin_checkout, add_shipping_info and purchase, with purchase marked as a key event. Property name hidden
Store C — pet accessories · GA4 events setup at handover: purchase marked as a key event.

Store D — specialty tea, project July 23–September 30, 2026 (10 weeks)

Google Search Console performance report for Store D, an anonymized US specialty tea store, web search, before the project, June 25 to July 22, 2026: 319 total clicks, 35,241 impressions, 0.9% average CTR and average position 35.2
Store D — specialty tea · Search Console, before: Jun 25–Jul 22, 2026. 319 clicks, position 35.2.
Google Search Console performance report for Store D, an anonymized US specialty tea store, web search, after the project, September 3 to 30, 2026: 2,749 total clicks, 118,623 impressions, 2.3% average CTR and average position 11.4
Store D — specialty tea · Search Console, after: Sep 3–30, 2026. 2,749 clicks, position 11.4.
Google Ads campaigns report for Store D, an anonymized US specialty tea store, closing window September 3 to 30, 2026, Performance Max, Shopping and brand Search campaigns: $317.94 cost, 1,634 clicks, 52 conversions, 2,564.83 conversion value and 8.07 conversion value per cost
Store D — specialty tea · Google Ads, Sep 3–30, 2026 (closing window): 52 conversions, ROAS 8.07.
Meta Ads Manager campaigns report for Store D, an anonymized US specialty tea store, closing window September 3 to 30, 2026, sales campaigns for broad prospecting, the product catalogue and retargeting: 48 website purchases, $294.83 spent, $2,356.47 purchase conversion value, 7.99 purchase ROAS and 1,843 link clicks
Store D — specialty tea · Meta Ads, Sep 3–30, 2026 (closing window): 48 purchases, ROAS 7.99.
Google Merchant Center product status for Store D, an anonymized US specialty tea store, September 3 to 30, 2026: 96 products, 95 approved, 1 limited, 0 not approved and 0 under review; the product list shows the loose-leaf breakfast tea tin approved and showing on Google
Store D — specialty tea · Merchant Center, Sep 3–30, 2026: 95 of 96 products approved.
Google Analytics 4 events screen for Store D, an anonymized US specialty tea store at handover: the e-commerce event set from view_item and add_to_cart to begin_checkout, add_shipping_info and purchase, with purchase marked as a key event. Property name hidden
Store D — specialty tea · GA4 events setup at handover: purchase marked as a key event.

Free growth audit

Find out what’s holding your store back.

Tell us about your store. We’ll review your tracking, campaigns and SEO and send you a written audit with the top fixes, ranked by impact.

  • Written audit as a PDF, delivered within 2 workdays (see a sample)
  • A video meeting to go through it, if you want to discuss next steps
  • Free and no obligation
  • Read-only access or screenshots are enough

Free audit
Chat on WhatsApp