An SEO monthly report sample is a filled-in report you can read before you buy one or write your own. This one covers an invented candle store for October 2026, with each line explained.
Every figure in this seo report sample is made up and labelled as an example. The arithmetic is real, so you can redo it with your own numbers, and the last sections list the lines worth challenging in any report you receive.
What does an SEO monthly report sample look like?
A short table of results, each shown against last month and the same month last year, followed by a summary, a work log and a plan. The sample below is the results table, 7 lines covering 3 months of figures, for one invented store.
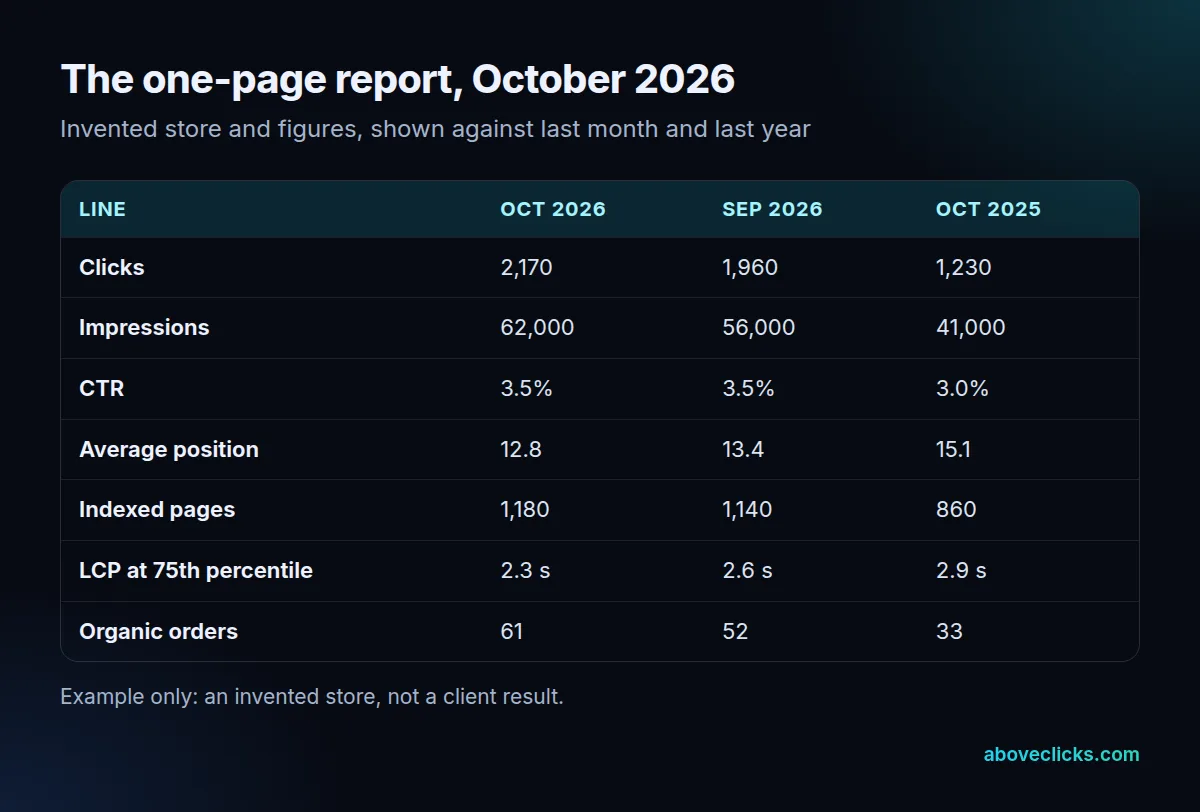
Most lines come from Google’s free tools. Search Console’s Performance report opens on the past three months by default and defines CTR as clicks divided by impressions. Its average position is that of the topmost result from your site.
Most downloadable examples are a PDF with placeholder charts, which tells you the layout and nothing about the arithmetic. A useful seo report sample shows real figures, so you can see how each line is worked out.
That is why this SEO monthly report has seven lines and three columns, and no more. The first four lines are search results, the next two are site health and the last one is business results. A monthly SEO report example only helps if it stays the same shape every time. The columns repeat every month, so October can be set against September and against October 2025 without hunting through old files.
What should the summary say?
Three sentences: what moved, the likely cause and the decision for you. The numbers in the table prove it, and the words explain it, which no dashboard does for you.
Here is the summary for the sample, written the way it should read.
Example: “Clicks rose 10.7% on September, from 1,960 to 2,170, and 76.4% on October last year, from 1,230. Organic orders rose from 52 to 61, up 17.3%. The rewritten collection titles and three new guides explain most of it, and we need your approval of four product descriptions by 10 November.”
An SEO monthly report should let you check the arithmetic: 2,170 divided by 1,960 is 1.107, and 2,170 divided by 1,230 is 1.764. Orders per 100 clicks stayed near 2.8, against 2.7 in September and 2.7 a year ago. So the order gain followed the click gain, which is what a report should show before it claims credit.
Orders are only as good as their tracking, and an seo monthly report that gives clicks without orders is half a report. In Google Analytics, a key event is an event you mark as important, such as a purchase, and it is then surfaced in your reports. Ask which event the report counts.
Where did the clicks come from?
From four page types, and the split matters more than the total. In the sample, 1,150 of the 2,170 clicks, or 53%, landed on collection pages, 640 on product pages, 290 on blog guides and 90 on the home page.
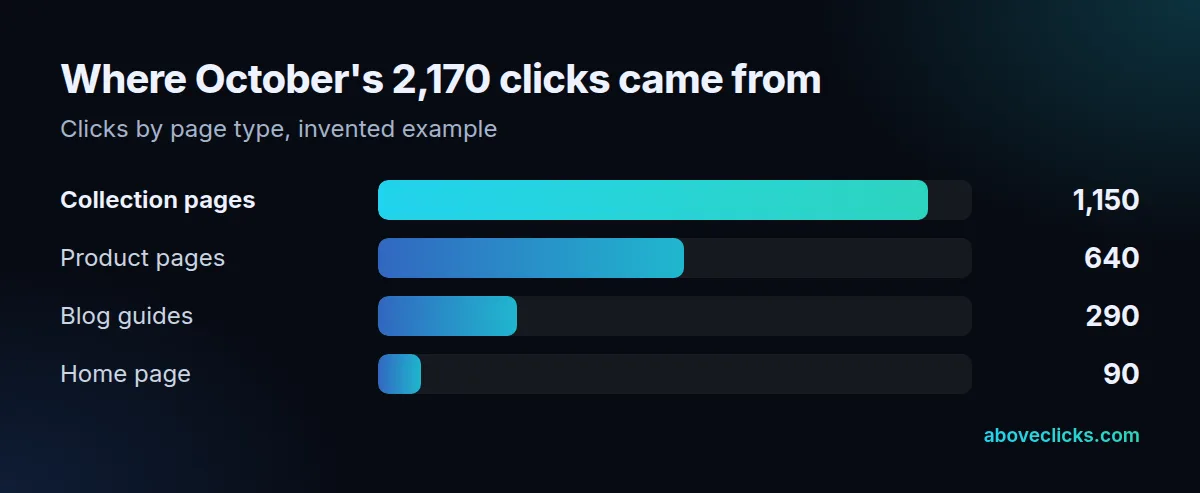
Search Console’s Performance report can group its table by queries, pages and devices, so a split like this is one click away for whoever builds the report. The sample adds a second cut: queries that contain the store’s name against those that don’t.
Non-brand clicks were 1,390 in October against 1,200 in September, a rise of 15.8%. Brand clicks were 780 against 760, up only 2.6%. People who already know the store will find it anyway, so the non-brand line is where the SEO work shows. An SEO monthly report that gives only the total hides which of the two grew, and the seo report sample above shows both.
The blog line of an SEO monthly report is worth a look too: 290 clicks against 240 in September, up 20.8% from three new guides. Small, but it is the line a content plan should move first.
What should the indexing and speed lines show?
Indexed pages that should be indexed, and speed measured the way Google measures it. The sample shows 1,180 indexed pages against 1,140 in September, and a loading time of 2.3 seconds at the 75th percentile.
Read the indexing line carefully. Google’s Page indexing report says you should not expect every URL on a site to be indexed, only the canonical version of each page, and its example lists stop at 1,000 rows. A report that celebrates a higher total should say how many new canonical pages the 40 extra indexed URLs are.
For speed, web.dev sets good targets for the Core Web Vitals at 2.5 seconds for Largest Contentful Paint, 200 milliseconds for Interaction to Next Paint and 0.1 for Cumulative Layout Shift, each measured at the 75th percentile of page loads. The sample’s 2.3 seconds passes, and September’s 2.6 seconds did not. If a line shows a score without naming the target it is judged against, ask for the target.
What does a good work log look like?
A dated list of finished items, each small enough to check. The compare graphic below puts four weak lines next to the same work written so you can verify it.
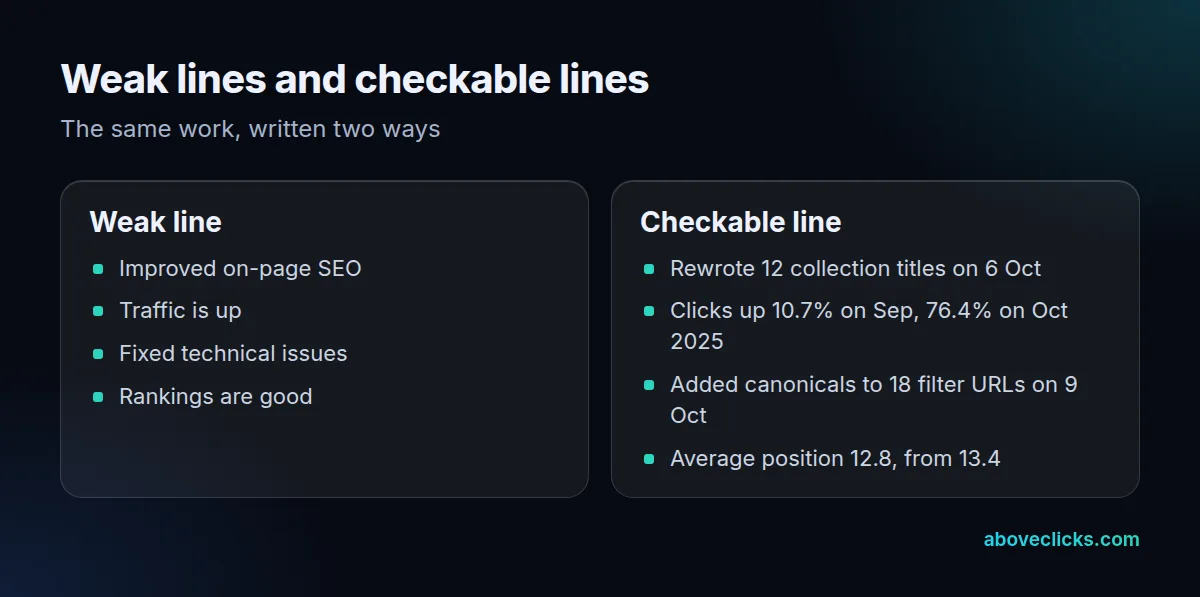
The sample’s October log has five entries:
- 6 Oct: rewrote the title tags of 12 collection pages (list in the appendix).
- 9 Oct: added canonical tags to 18 filter URLs that duplicated their parent collection pages.
- 14 Oct: published 3 buying guides, each linked from 2 collection pages.
- 20 Oct: preloaded the main collection banner, which moved loading from 2.6 to 2.3 seconds.
- 27 Oct: resubmitted the sitemap after the new guides went live.
A monthly SEO report example is only as good as its log, because the log is what connects the numbers to the work. Then comes the plan for November, which names pages rather than themes, and a short list of what is waiting on you. A log with no dates cannot explain a dip, and a plan with no pages cannot be checked next month.
Which lines in an SEO report sample should you challenge?
Any line with no date range, no comparison, no source or no page named. Six questions catch most weak reports, and this SEO monthly report sample passes all six.
- Is the date range stated? “Traffic is up” without one is a slogan.
- Is there a same-month-last-year column? Google’s traffic-drop guide suggests setting the Performance report to the last 16 months, so the comparison is always available.
- Was a core update in the month? Google suggests waiting at least a full week after one finishes before analyzing the change.
- Is the source named? Each line should say which report it came from.
- Are orders or leads shown? Clicks that never reach a purchase are a finding to explain, not a win.
- Does every work item have a date and a page? “Fixed technical issues” fails; “added canonicals to 18 filter URLs on 9 Oct” passes.
Take the second question as an example. A store that sells candles sees impressions climb every autumn, so a report that compares October with September alone credits the work with growth the calendar produced. The same-month column in the SEO monthly report sample shows October 2025 at 1,230 clicks, so the real gain over the season is visible.
If a report fails two or more, ask for the missing items before the next invoice. For the wider checklist, our guide to the monthly SEO report lists the seven sections, and SEO monthly reporting covers the monthly cycle and the data to save.
How do you turn this sample into your own report?
Keep the three-column table from the seo monthly report sample, fill each line from its source, write the three-sentence summary last and add your work log. Allow about an hour the first time and less after that, because the layout never changes.
Get read-only access to your own Search Console and Analytics, so the numbers can be checked by anyone. Pull the month’s data on its first day, copy the totals into the table and work out the two percentage columns. Then split the clicks by page type and by brand and non-brand queries, which takes two more filters.
Two habits keep the report honest as the months pile up. Save a copy of each month’s table in a folder named by month, so a year from now you hold 12 reports that line up. And change one thing at a time in the layout, because a new column in month 7 makes months 1 to 6 impossible to compare.
On our side, the first report for ecommerce SEO arrives 30 days after the work starts, and each later one lands in the first week of the month. If you are still choosing what the work behind the report should be, the monthly SEO package guide covers what each quarter should deliver, and our own sample report shows the layout with illustrative figures.
For a second opinion on a report you already receive, our free audit can check it against your Search Console. More guides are in ecommerce SEO.