How to use Google Analytics 4 comes down to one habit: open the Reports snapshot first, then check five things in the same order each week: where visitors come from, where they land, whether they engage, which key events happen, and whether the totals match your store.
This guide shows how to use GA4 without learning every one of the Google Analytics 4 reports. It covers the first screens, the one report for each question, how to read the main numbers, when to switch to Explorations, and a 20-minute routine. For a plain definition, see our Google Analytics 4 glossary entry.
How to use Google Analytics 4: where do you start?
In the Reports snapshot. Google’s overview of reports says that when you open Reports you see a snapshot, a Realtime report and a set of report collections.
The Reports snapshot lets you choose one of 3 templates: User behavior, Sales and revenue, or Marketing performance. Pick Sales and revenue if you run a store. You can then add, remove or rearrange the cards.
Realtime is the other screen you will meet early. Google’s Realtime report shows active users in the last 5 and 30 minutes, and lists the pages and events they trigger. It is handy for checking that the tracking code works after a change.
If you are new, practice first. Google’s demo account is fully functional, open to any Google user, and contains 2 properties with real store data. Click through every report there before you open your own, which is the safest way to learn Google Analytics 4 for beginners.
One more point before you start: the Google Analytics 4 reports only fill up if the tag is installed and sending data. Google’s report overview notes that some data arrives as soon as you set up Google Analytics, while other data needs extra setup. If Realtime stays empty while you browse your own site, fix that first.
Which five reports answer a store owner’s first questions?
One report per question: Traffic acquisition for sources, the Landing page report for entry pages, engagement rate for quality, the key events column for results, and your store’s order list as the check.
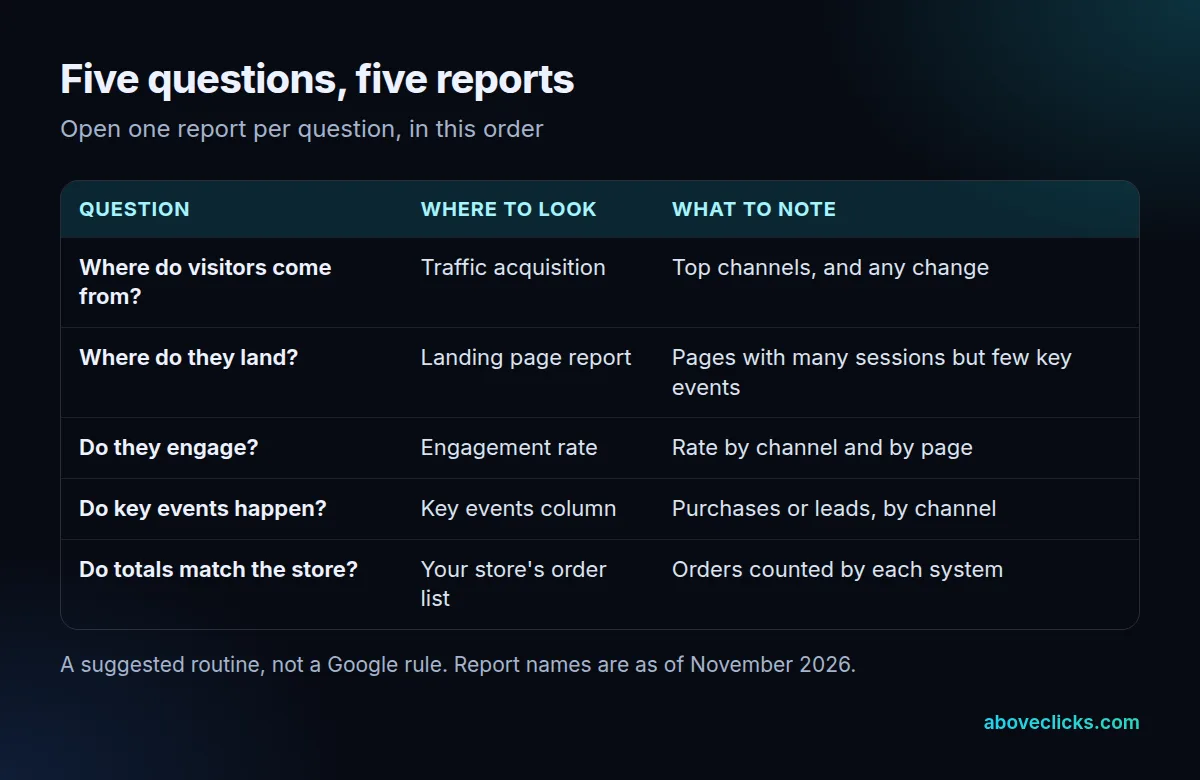
The table is our suggested routine, not a Google rule, and the report names are as of November 2026. If a name has moved, search for it in the report list or ask an Editor to add it back; Google’s pages say removed reports can be restored from the left navigation.
Two details save confusion when you work through these Google Analytics 4 reports. First, Google’s traffic acquisition page explains that this report shows where new and returning users come from, while the separate User acquisition report shows only new users. Second, a landing page is the first page of a visit, and the Entrances and exits page explains that Entrances is a metric while Landing page is a dimension.
How do you read users, sessions and engagement rate?
Start with the definitions, because how to read Google Analytics 4 depends on them, and because the same word means different things in different reports. Google’s user metrics page separates total users, active users and new users, and reports normally show active users.
A session is a visit. By default, a session times out after 30 minutes of inactivity, according to Google’s sessions page, and there is no limit on how long one can last.
An engaged session is a session that lasts longer than 10 seconds, has a key event, or has 2 or more page or screen views. Engagement rate is the share of sessions that are engaged, and bounce rate is the opposite. Both come from Google’s engagement rate page.
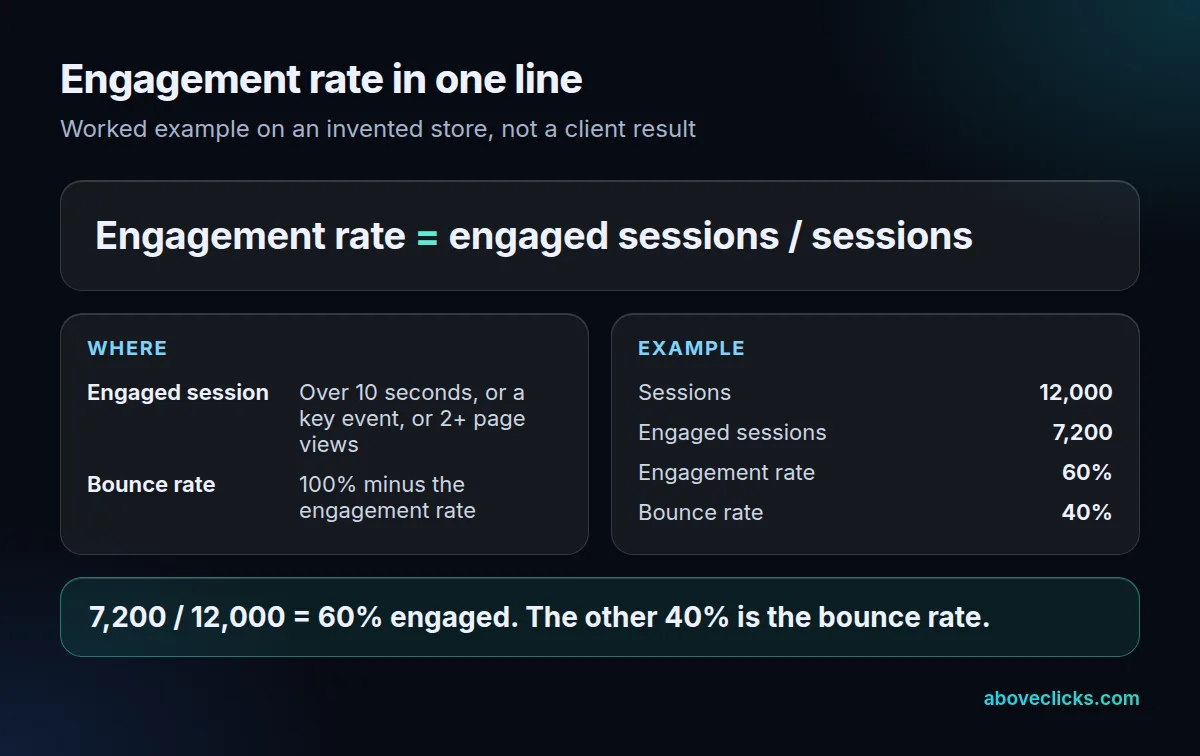
Example: a store with 12,000 sessions in a month and 7,200 engaged sessions has a 60% engagement rate and a 40% bounce rate. The store is invented; the arithmetic is the whole point.
One catch for anyone learning how to read Google Analytics 4: Google notes that most reports do not show engagement rate or bounce rate by default. An Editor or Administrator can add them with the Customize report button.
How do you see where your traffic comes from?
Open Reports, then Acquisition, then Traffic acquisition. The default view groups visits by session default channel grouping, such as Direct, Organic Search, Paid Social, Organic Social and Email.
Of all the Google Analytics 4 reports, this is the one to open first. To look at one source, search for it above the table. Google’s example is typing “google / organic” to see organic Google Search traffic only.
The reports are only as good as the data going in. Google’s page says source data comes from manually tagged links or from integrations such as Google Ads. If your emails and social posts carry no tags, they fall into Direct or into the wrong channel. Example: if 4,800 of your 12,000 sessions are Organic Search, that channel is 40% of the traffic. The store is invented, but the check is the one to repeat each week. Our guide to GA4 in marketing shows how to tag links, and the attribution guide explains why Google Ads and Google Analytics can show different totals.
How do you track conversions in Google Analytics 4?
By marking the actions that matter as key events. Google defines a key event as an event that measures an action particularly important to the success of your business, and it appears in your reports once someone triggers it.
For a store, that is usually the purchase. For a service business, it might be a submitted form or a booked call. Once a key event exists, the key events column in acquisition and landing page reports shows how many each channel or page produced.
That is the core of how to use Google Analytics 4 for a store: define the result, then let the reports count it.
The risk is a key event that fires twice or not at all. Compare the Google Analytics count with your store for one week before you trust it. Example: 90 orders in the store against 72 purchases in Google Analytics is a 20% gap, which is too large to ignore. Our free tracking audit does that check, and we send the gaps within 2 workdays. The tracking health check gives a first read in a few minutes.
When should you use Explorations instead of reports?
When a standard report can’t answer your question. Google describes Explorations as a set of techniques that go beyond standard reports, including free form, cohort, funnel, segment overlap and path exploration.
Most people learning how to use GA4 never need more than a free-form table. A free-form exploration gives you a familiar table where you pick the rows and the numbers. For example, you could list landing pages with their sessions and key events side by side. A funnel exploration shows where visitors drop out between steps.
Mind the retention setting. Google’s data retention page says standard properties can keep user-level data for 2 or 14 months, and that the setting affects explorations and funnel reports, not the standard aggregated reports. If you want year-on-year explorations, switch to 14 months now, since the setting is not applied backwards to data already deleted.
What does a 20-minute weekly routine look like?
Five checks in a fixed order is how to use Google Analytics 4 in 20 minutes a week: 3 minutes on the snapshot, 5 on traffic, 5 on pages, 4 on key events and 3 on the store.
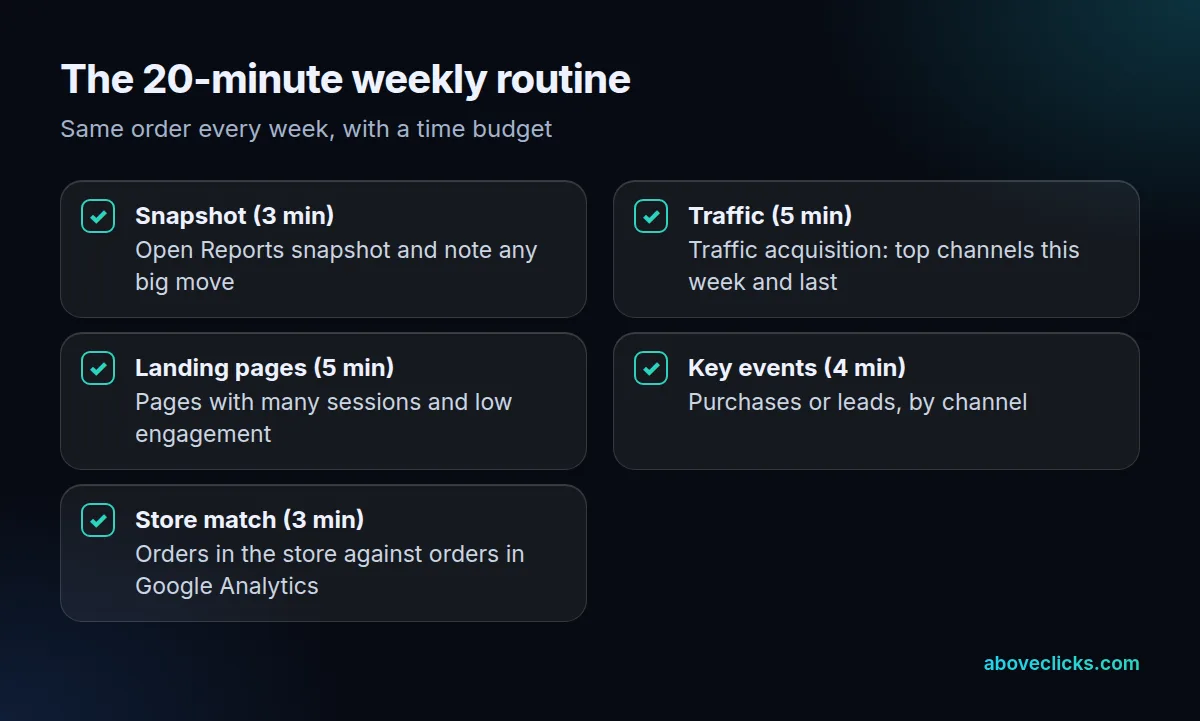
Write down three numbers each week: sessions, engagement rate and key events. A short note beside them, such as “email campaign sent Tuesday”, is enough. After 4 weeks you have a baseline, and a real change stands out from normal movement.
That log is the real answer to how to read Google Analytics 4 over time, and to how to use GA4 without drowning in it. A simple page or spreadsheet works:
- Week 1: 12,000 sessions, 60% engagement rate, 150 purchases
- Week 2: 12,600 sessions, 59% engagement rate, 158 purchases
- Week 3: 9,100 sessions, 61% engagement rate, 118 purchases
The numbers are invented. Week 3 shows a traffic drop with steady engagement, which points to fewer visits rather than worse pages, so you would look at the traffic report first.
If something looks wrong, fix the tracking before you change the marketing. Missing purchases, doubled events and a gap against the store are all tracking problems first. The pillar page on measurement lists our other guides, and our tracking and analytics service covers the repair work.
Which mistakes make Google Analytics 4 numbers misleading?
Four mistakes undermine the Google Analytics 4 reports most often. Each is easy to avoid once you know it.
- Judging results in Realtime. Google describes Realtime as a best-effort service with no formal service level objective, so use it to confirm tracking, not to judge a campaign.
- Mixing up users and sessions. One person with 3 visits is 1 user and 3 sessions. Compare like with like week to week.
- Reading bounce rate as the old metric. It is now the share of sessions that are not engaged, so a 40% rate means 4 in 10 sessions had no key event, ran under 10 seconds and had only one view.
- Assuming old data is still there. With a 2-month retention setting, explorations lose older data on a monthly cycle. Set 14 months early.
Finally, remember that every number in the Google Analytics 4 reports depends on what the tag collects. A page that never loads the tag is invisible, so check coverage after any theme change or checkout update.
Done weekly, this is how to use Google Analytics 4 with confidence: the same five checks, the same order, and a note of what changed. If the totals stop matching your store, book a tracking audit before you change a campaign.