A Facebook ads conversion rate is the share of people who take your chosen result, such as a purchase, after seeing or clicking an ad. Meta divides by impressions, while most advertisers divide by link clicks or landing page views, so name the denominator first.
This guide shows three ways to calculate it from the same ad, how to work out the rate you need instead of chasing a benchmark, and the order to check when the number looks low. All store figures are invented examples, and Meta definitions were read in October 2026.
What is a Facebook ads conversion rate?
It’s results divided by a base number, and the base can be impressions, clicks or visits. The result is whatever outcome your campaign is set to count, so a purchase campaign counts purchases and a lead campaign counts leads.
Meta’s own report column is called result rate: the percentage of results out of the number of impressions. That number is tiny, often well under 1%, because most people who see an ad don’t click it.
Most advertisers mean something else. They divide purchases by link clicks or by landing page views, because that shows what happens after the visit. Neither is wrong, but a Facebook advertising conversion rate quoted without its denominator can’t be compared with anything. Write the base next to the percentage every time, for example “2.4% of link clicks”.
What counts as a result also depends on your objective and settings. According to Meta’s Results page, the metric counts outcomes based on the objective and settings you selected, and some results may be statistically modeled where data is partial or missing.
How do you calculate the Facebook ads conversion rate?
Divide the results by the base you chose and multiply by 100. Calculate the Facebook ads conversion rate at least twice, per link click and per landing page view, so you can see where people drop out.
Example: an invented store runs one ad to 50,000 impressions, which brings 1,000 link clicks (a 2.0% CTR), 800 landing page views and 24 purchases.
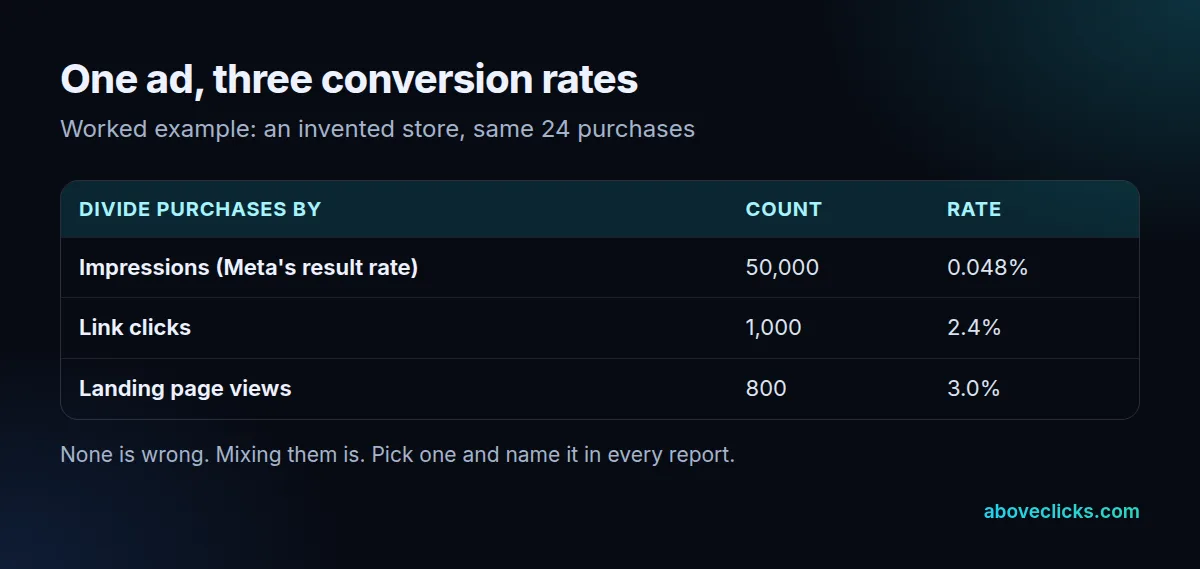
The three rates are 0.048%, 2.4% and 3.0%. The gap between the last two matters most. Meta explains that link clicks and landing page views differ when a page doesn’t fully load or an ad has several destinations. Here 200 of 1,000 clicks, or 20%, never reached the page.
CTR is a separate number. Meta defines CTR (link click-through rate) as link clicks divided by impressions, so it tells you how well the ad earns a click, not how well the site turns the visit into a sale.
A quick way to read the three together:
- Low CTR: the ad or audience is the weak spot.
- Healthy CTR but a big click-to-page drop: speed, redirects or the in-app browser.
- Healthy page views but few purchases: the page, offer or checkout.
What is a good conversion rate for Facebook ads?
The one that beats your break-even rate. A conversion rate for Facebook ads that looks high can still lose money, and a modest one can be profitable, because cost per click and gross profit decide it.
The formula is simple: break-even conversion rate = cost per click ÷ gross profit per order. It works for any facebook advertising conversion rate, whatever the industry. Example: an invented store pays $1.20 per link click and earns $35 gross profit on an average order. $1.20 ÷ $35 gives 3.4%.
At that rate, 1,000 clicks produce about 34 purchases, and the ad pays for itself before overhead. At the 2.4% from the earlier example, the same clicks bring 24 purchases, so each costs $50 against $35 of gross profit. That’s a loss of $15 on every sale, or $360 across the 24.
Pick the result carefully, too. A rate built on add to cart events looks far better than one built on purchases, but only purchases pay the bills. Count the event you would be willing to pay for.
Use the same logic with ROAS, which many advertisers prefer to a conversion rate for Facebook ads. Our break-even ROAS calculator works out the return you need from your margin, and the conversion rate above is the same break-even seen from the click side.
Is there an average conversion rate by industry?
Not one we can verify. We found no industry conversion rate on the Meta pages we read, and published averages mix different events, windows and denominators. A borrowed number can make a profitable ad look weak, or a losing one look fine.
Prices, trust and the sales cycle change a Facebook ads conversion rate more than the industry label does. A $20 accessory and a $2,000 sofa both count as “retail”, but their rates have nothing in common.
Better benchmarks, in this order:
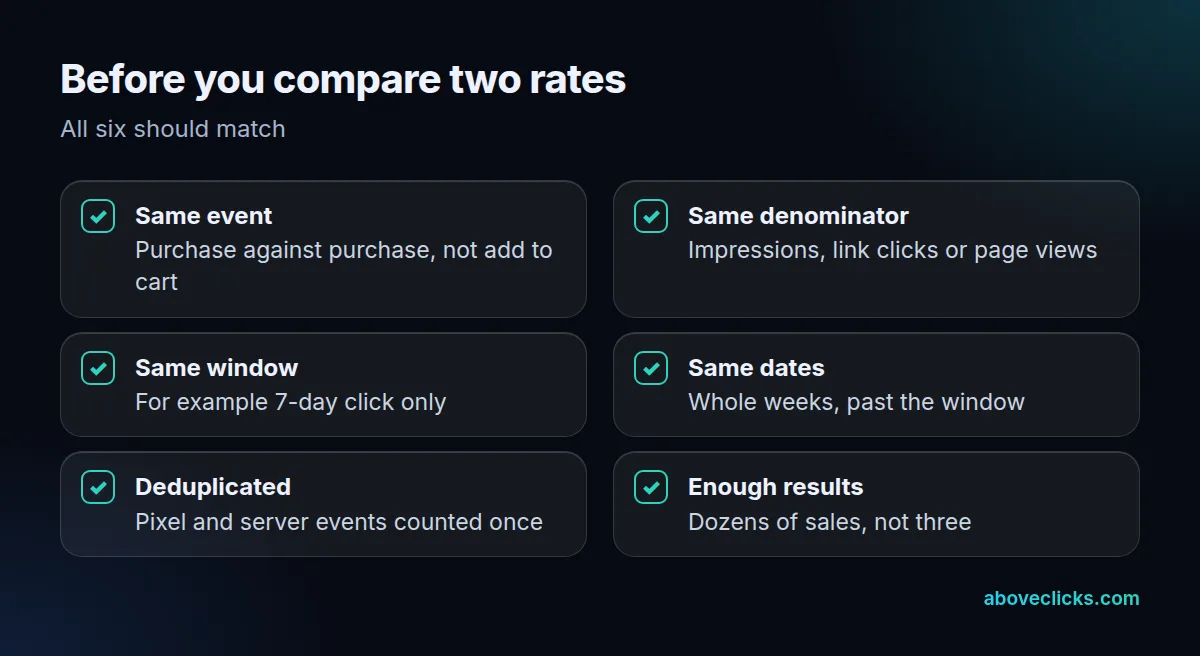
- Your own past ads: the same event, window and denominator, over whole weeks.
- Your break-even rate: the number from the section above.
- Your own funnel steps: click to landing page view, landing page view to add to cart, cart to purchase.
If you want an outside read, our free audit compares your account against these checks, with read-only access.
Why is your Facebook ads conversion rate low?
Usually because of tracking, a click-to-page drop, the page or the offer, rather than the audience. Check them in this order, cheapest first, before you touch targeting.
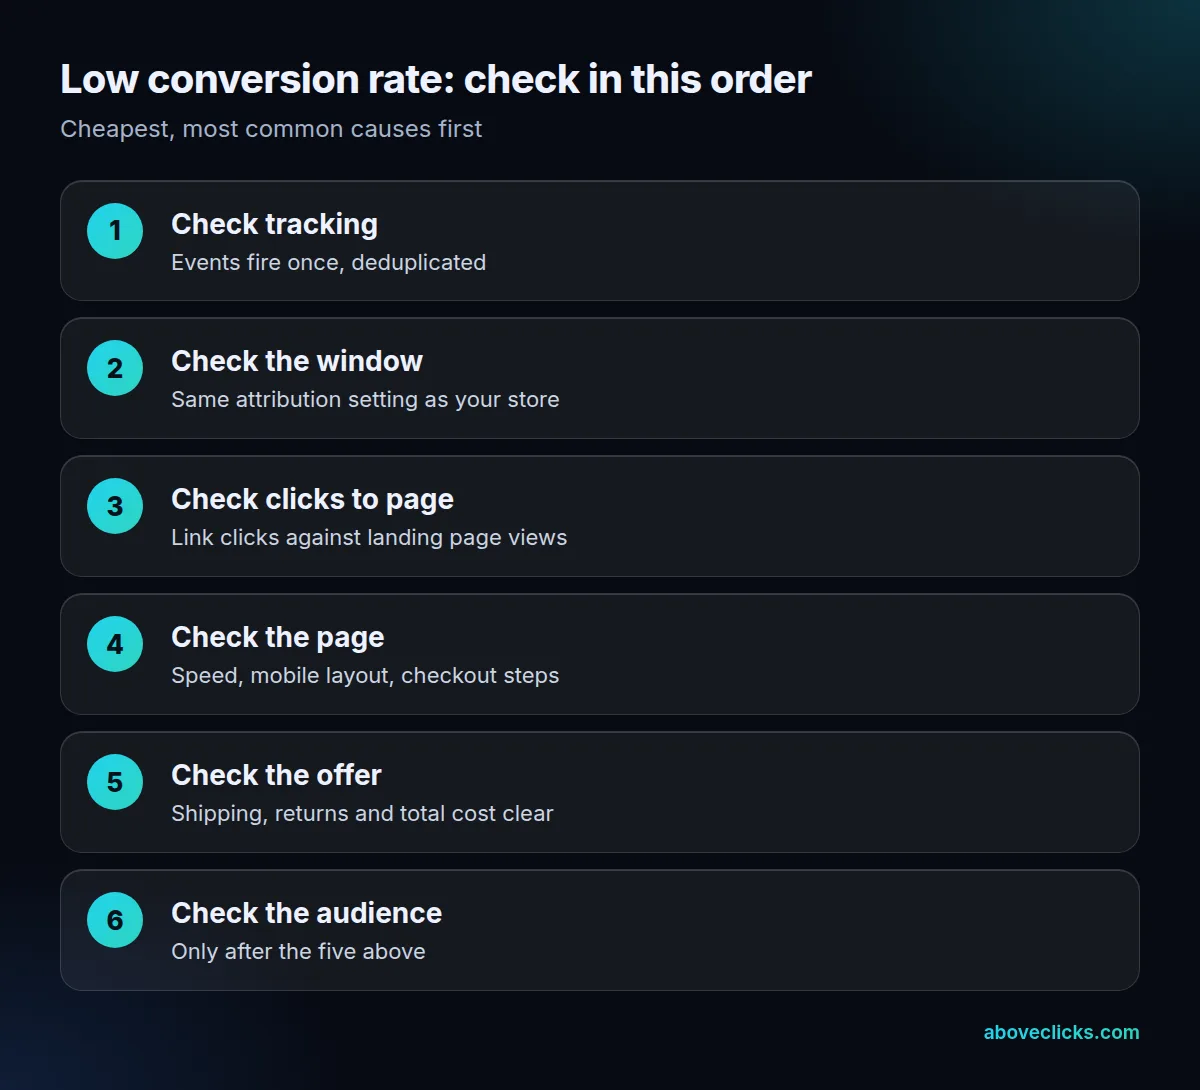
- Tracking: if the Pixel and Conversions API both send purchases, they must be deduplicated, or counts are inflated. Our Conversions API guide for Shopify covers the setup.
- Attribution window: compare the window in your report with the one your store uses, as the next section explains.
- Clicks to page: in the example, 20% of clicks never loaded the page. Check page speed on mobile and any redirect after the click.
- The page: a product page that shows the shipping cost only at checkout loses buyers at the last step.
- The offer: unclear returns, delivery times or total cost.
- The audience: change it last. It’s the easiest setting to change and the least likely cause.
Four mistakes make a healthy Facebook ads conversion rate look weak, or a weak one look healthy:
- Reading it too early: with a 7-day click window, a rate read after 2 days leaves out sales still to be credited.
- Comparing unlike numbers: the conversion rate of Facebook ads includes view and engagement credit by default, while your store’s report usually does not.
- Judging on a handful of sales: 3 purchases can swing the rate by a third from one day to the next.
- Changing everything at once: a new audience, creative and page in the same week mean you can’t trace the cause.
Creative also matters, but mostly through the click: an ad that promises more than the page delivers raises the CTR and lowers the rate after it. Our guide to Meta ads creative testing shows how to test that cleanly, and the e-commerce Meta ads guide covers account structure. For the general method, see how to improve conversion rate.
Why does Facebook show a different rate than your store?
Because Meta and your store count differently, so a Facebook ads conversion rate from one rarely matches the other. They use different attribution windows, Meta may model some results, and the same sale can be sent twice by the Pixel and the Conversions API.
Meta’s Results page says the default attribution setting is 7-day click, 1-day view and 1-day engagement. Your store counts a sale once, on the day it happens, with no view credit.
Meta’s attribution settings are click-through (1-day or 7-day), view-through (1-day) and engage-through (1-day) for the standard model. Results can’t be compared across ad sets that use different attribution models.
Use Compare attribution settings to see 1-day view, 1-day click, 7-day click and 28-day click side by side. If a campaign has been live for less than 28 days, the 28-day view only shows partial data.
Duplicate events are the other classic cause. Meta’s deduplication rules match identical events by event ID and name, and server events aren’t discarded if no browser event arrived in the past 48 hours.
How does conversion rate change your cost per conversion?
Your Facebook ads conversion rate sets your cost per conversion. Cost per conversion equals cost per click divided by the conversion rate. Halve the rate and the cost per purchase doubles, with spend and clicks unchanged.
Example: at $1.20 per click, a 2.4% rate means $1.20 ÷ 0.024 = $50 per purchase. At 3.4% it’s about $35. The only thing that changed is what happens after the click.
A higher conversion rate Facebook advertising campaign wins on cost even when clicks stay as expensive as before. The break-even rate also moves when clicks get dearer. If the invented store’s cost per click rises from $1.20 to $1.50 in a busy season, the rate it needs rises from 3.4% to 4.3% ($1.50 ÷ $35). Recalculate it whenever your cost per click, margin or average order changes, not once a year.
So there are two levers: pay less per click, or convert more of the clicks you already pay for. The second is usually cheaper to fix, and the fix lasts across every campaign that sends traffic to that page.
Our Meta ads management page lists current starting fees for audits and management; the audit itself is free and compares your rate against the break-even rate above. For more on this topic, see the Meta Ads guides.