Conversion rate fb ads is the share of paid clicks that end in a purchase, and it sets your cost per purchase. The formula is short: cost per click divided by the conversion rate gives what each sale costs you.
This guide prices the conversion rate. It shows four rates on one budget, why a better rate can beat a cheaper click, which fixes to try first, and what conversion work costs against what it earns back. For the formulas and break-even rate, read our guide to the Facebook ads conversion rate. All store figures here are invented examples.
What does conversion rate fb ads mean, and why does it set your cost?
The conversion rate fb ads report is purchases divided by clicks, and it sets your cost because you pay for the clicks, not the sales. At $1.00 per click and a 1.5% rate, it takes about 67 clicks to get one purchase, so each purchase costs about $67.
Meta reports a cost per result too. Its cost per result page defines it as the average cost per result from your ads, and says it is affected by your auction bid, audience, optimization type, creative and schedule. The page does not list the landing page, but the rate your page converts at moves the same number.
That is why two advertisers with identical ads and the same conversion rate fb ads target can pay very different amounts per sale. The conversion rate facebook ads report shows is the second half of the cost equation, and it is the half the ad settings do not control.
How does the conversion rate change your cost per purchase?
Cost per purchase falls as your facebook ads conversion rate rises, and the fall is steeper than it looks. Doubling a rate halves the cost per purchase, so small gains at low rates are worth the most.
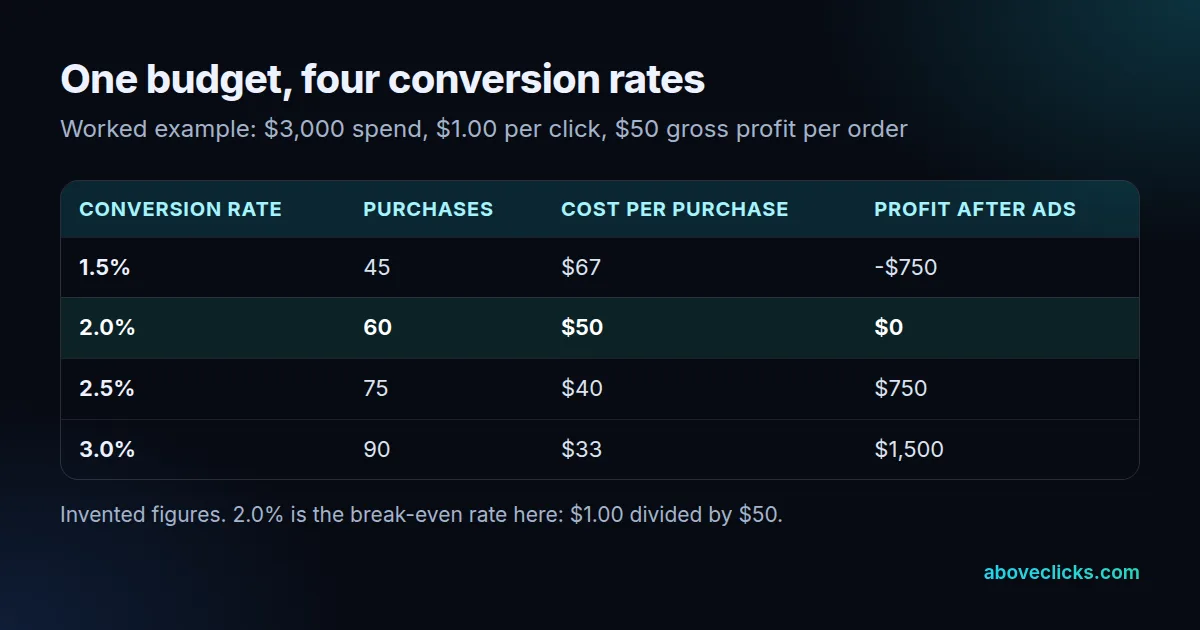
The example spends $3,000 at $1.00 per click, so 3,000 clicks, with $50 of gross profit on each order. At 1.5% that is 45 purchases at $67 each and a $750 loss before overhead. At 2.0% it is 60 purchases at $50, which is the break-even rate. At 3.0% it is 90 purchases at $33 and $1,500 of profit.
Read across the rows, not down one column. Each extra half point of conversion adds 15 purchases, but the first half point is worth the most because it moves the account across the break-even line. The spend never changed. Only the share of clicks that bought changed, and it moved the account from losing money to making it. That swing is what a conversion rate fb ads review is really measuring, and why every conversion rate facebook ads report should sit next to click cost.
What is a good conversion rate for Facebook ads?
A good conversion rate for Facebook ads is the one that beats your break-even rate, which is cost per click divided by gross profit per order. In the example that is $1.00 divided by $50, or 2.0%.
We do not quote an industry average, because we found none on the Meta pages we read, and published averages mix events and denominators. The live guide linked above walks through how to compare against your own past ads instead. Here the point is narrower: a facebook ads conversion rate is good or bad only next to your click cost and your margin.
Check your conversion rate facebook ads figure again whenever click costs move. A rate that was profitable at $0.80 per click loses money at $1.20, with no change to the page: the break-even rate rises from 1.6% to 2.4% when the click cost rises by half. Margin works the same way. A discount that cuts gross profit per order from $50 to $40 lifts the 2.0% break-even to 2.5%, so a sale can raise the conversion rate and still lose money on every order.
Where do you check the conversion rate in Facebook ads?
You find the conversion rate facebook ads figure in Ads Manager, by adding the purchase results and the clicks columns, then dividing yourself so you control the denominator. Use landing page views as the base when you want to know what happens after the page loads.
Meta explains that link clicks and landing page views are related but different: landing page views count the clicks that successfully loaded your website or shop. When the page does not fully load after a click, the two numbers drift apart.
Compare three numbers for the same week:
- Link clicks: what you paid for.
- Landing page views: the visits that arrived.
- Purchases: what the visits turned into.
If the first two are far apart, the problem is the click-to-page step, not the offer. In the example, 3,000 clicks and 2,400 landing page views mean 600 clicks, or 20%, never reached the page. Those clicks cost $600 of the $3,000 budget and could not convert at any rate. Fix that before you change a single sentence on the page.
Which fixes raise a low conversion rate first?
To raise a low conversion rate fb ads figure, go tracking first, then page load, then the match between ad and page, then the offer and checkout. Go in that order because each step is cheaper than the next and can explain the whole gap.
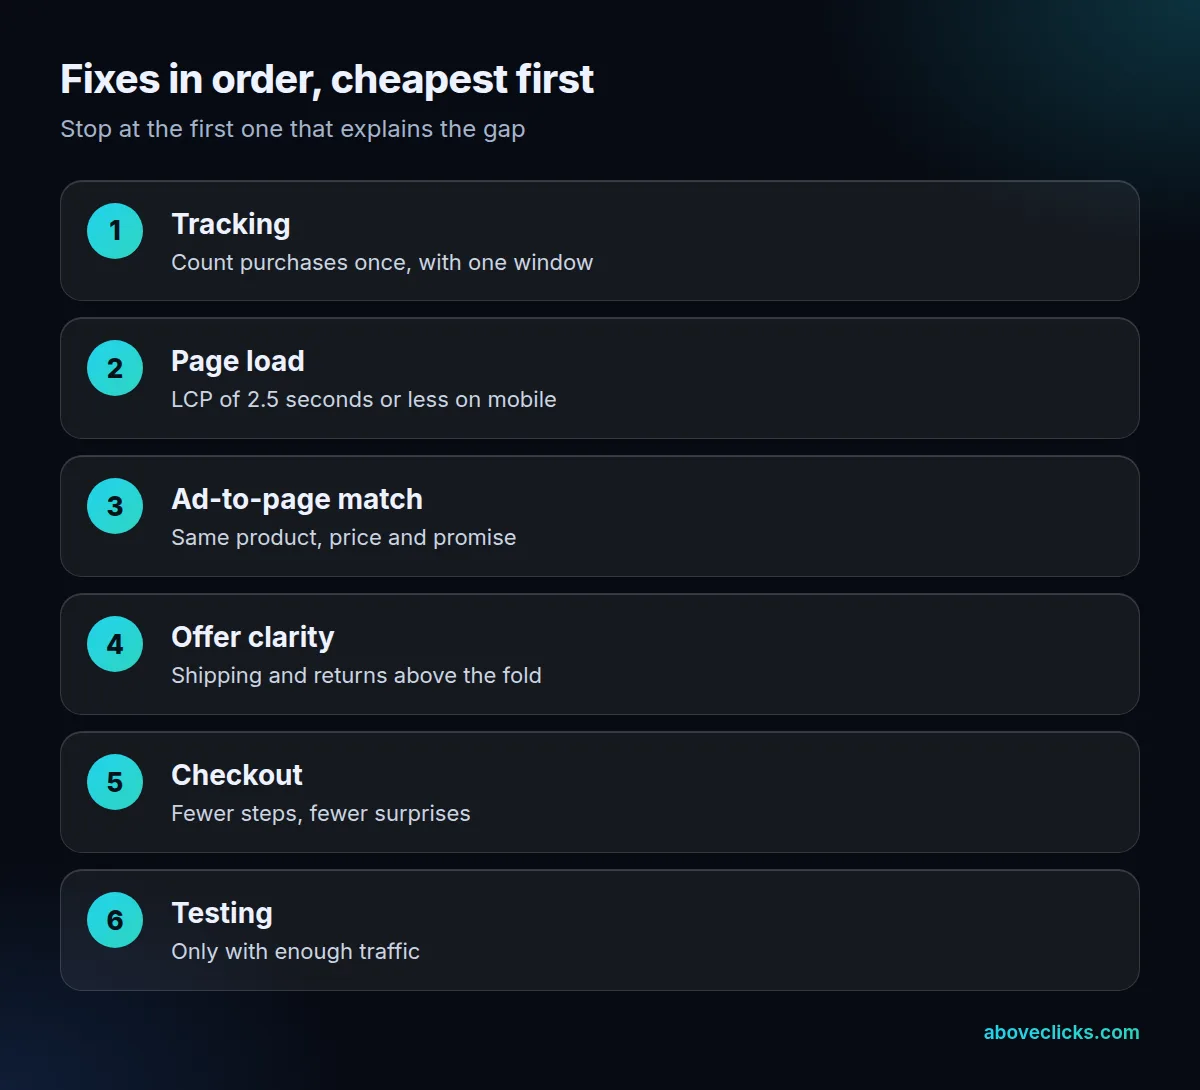
Page load deserves early attention for any facebook ads conversion rate because slow pages lose the click you already paid for. Google’s Largest Contentful Paint guidance sets a good value at 2.5 seconds or less, measured at the 75th percentile of visits, and it is one of the three Core Web Vitals that describe page experience. Test your product page on a phone, since most paid social clicks arrive there, and test it on a normal mobile connection rather than office wifi. A product page that takes 4 seconds to show its main image loses part of the click before the buyer sees a price, a photo or a button.
The late steps matter too. Baymard’s collected studies give an average cart abandonment rate of 70.22% as of November 2026, so most people who start a checkout leave it. Shipping cost, delivery time and returns shown early are the cheapest checkout fixes. Change one thing at a time where you can, write down the date, and compare whole weeks afterwards, so that you know which change did the work. Our guide on how to improve conversion rate covers the page-side fixes in more depth.
Is a higher conversion rate cheaper than cheaper clicks?
Often, yes. A conversion rate fb ads lift of one third cuts your cost per purchase by the same 25% as a click that is one quarter cheaper, and the lift keeps working in every campaign.
In the example, going from 1.5% to 2.0% is a one-third lift, and each purchase drops from $67 to $50. To get the same $50 with the page unchanged, you would need clicks at $0.75 instead of $1.00. Cutting a click cost by 25% means better creative, a narrower audience or a lucky auction, and none of those is permanent. Our guide to how much Meta ads cost explains what moves the click cost, and the pieces that a single account controls.
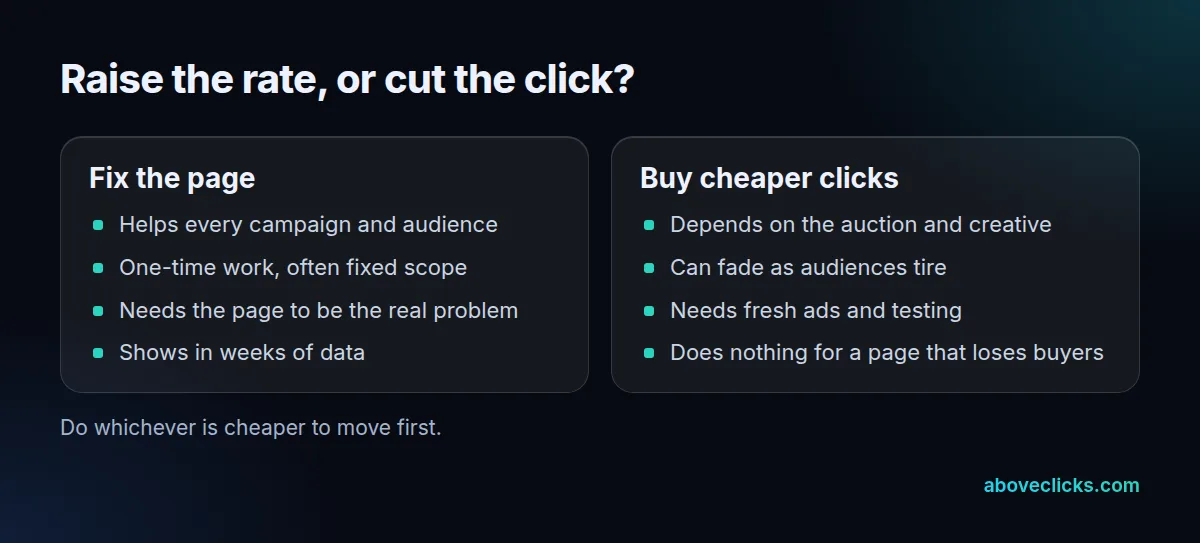
Do the arithmetic with your own numbers before you decide: divide your click cost by your conversion rate, then redo it with a rate one third higher and a click cost one quarter lower. The two results are the same, and the one you can reach with less effort is the better first move. The two are not rivals, and neither changes a facebook ads conversion rate alone. Cheaper clicks help only if the page converts them, and a strong page wastes its strength on poor clicks. Start with the one that is cheaper for you to move.
What does conversion rate work cost, and when does it pay back?
A fixed-scope sprint starts from $500 at our Shopify CRO service, and monthly work starts from $600, as of November 2026. Whether it pays back depends on how many purchases the lift in your conversion rate facebook ads figure adds.
Take the example store. A lift from 1.5% to 2.0% adds 15 purchases a month at the same ad spend, worth $750 of gross profit. A $500 sprint pays back inside the first month if the lift holds. A $600 monthly plan would need that lift to continue or grow, so it suits stores with steady traffic and a backlog of changes.
Traffic decides the method too. Our published conversion rate optimization test compared 2.60% and 3.10% purchase conversion over 28 days, with about 24,000 eligible visitors in each variant. The $3,000 example above buys only 3,000 clicks a month, so a split test is out of reach. A before-and-after comparison of whole weeks, like our Shopify case that moved from 1.59% to 2.86%, is the honest method at that size, and it does not isolate one change.
Before you pay anyone, our free audit can check the account and the page and rank the fixes. More guides on the ad side sit in Meta Ads.