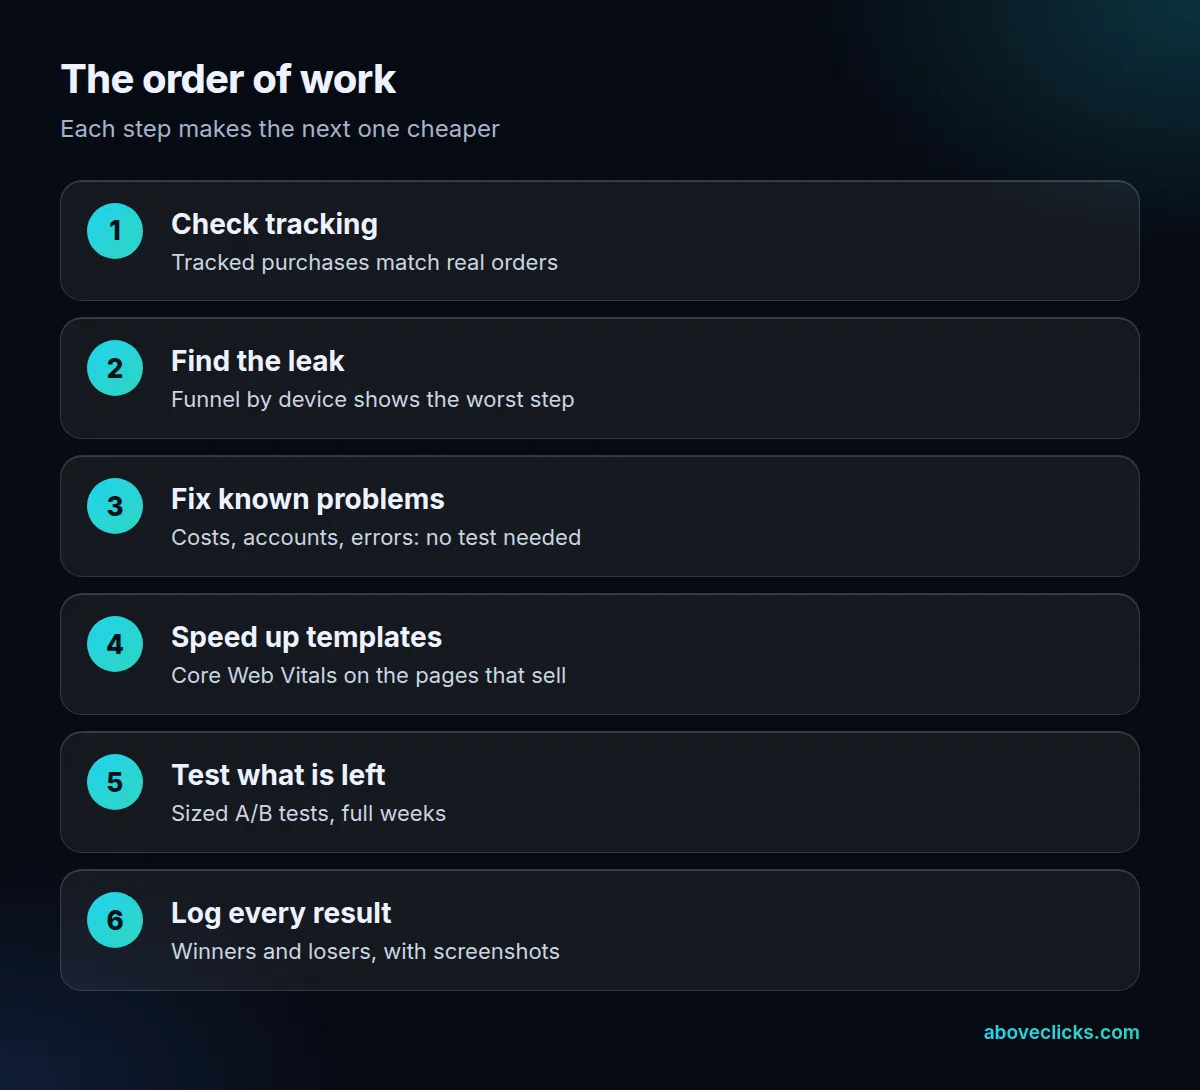
How to improve conversion rate comes down to order: check that sales are tracked correctly, find the step where buyers leave, fix the known problems, then A/B test what is left. Each step makes the next one cheaper.
Most lists of tips skip the order. This guide shows how to improve conversion rate one step at a time, with the checks we run before we change any page, a table that sorts fixes from tests, and a way to tell whether a page even has the traffic to test.
Is your conversion rate measured correctly?
Check this first. If tracked purchases don’t match real orders, every later step works on a wrong number, so compare the two before you change a single page.
Google Ads defines a conversion rate as conversions divided by the ad interactions that can be tracked to a conversion in the same period: 50 conversions from 1,000 interactions is 5%. Your store, GA4 and each ad platform count both halves differently, which is why their figures rarely agree. Our conversion rate glossary entry explains those differences, so we won’t repeat them here.
The practical check takes an hour:
- Export last month’s orders from your store.
- Compare the count with purchases in GA4 for the same dates and time zone.
- If more than a few percent are missing, fix tracking before anything else.
On our conversion rate optimization page we show an example store where the testing tool missed 16% of orders. Any test run on that setup would have been read against a wrong baseline.
Why is my website conversion rate so low?
Usually one step loses far more buyers than the others. A funnel report split by device shows which one, so you can work on that step instead of the whole site.
GA4’s funnel exploration lets you lay out the steps a visitor takes, such as product page, cart, checkout and purchase, and see how many fail at each one. Split it by device and by traffic source. A mobile cart step that loses twice as many people as desktop is a far better lead than a site-wide average.
This is the step most advice on how to improve conversion rate skips. Then watch real people. Nielsen Norman Group’s research on testing with 5 users found that small, repeated usability tests with no more than 5 people find most of the problems. Ask 5 people who match your buyers to place an order while you watch, and note where they hesitate.
Session recordings, on-site search terms and the questions your support team answers every week fill in the rest. When the same complaint appears in two of those sources, it goes to the top of the list.
Which fixes don’t need an A/B test?
Broken buttons, surprise costs, a forced account and checkout errors. These are known causes of lost orders, so fix them straight away and measure the weeks before against the weeks after.
As of October 2026, Baymard Institute’s average of 50 studies puts documented cart abandonment at 70.22%. Its own survey of US shoppers, leaving out those just browsing, gives the reasons below.
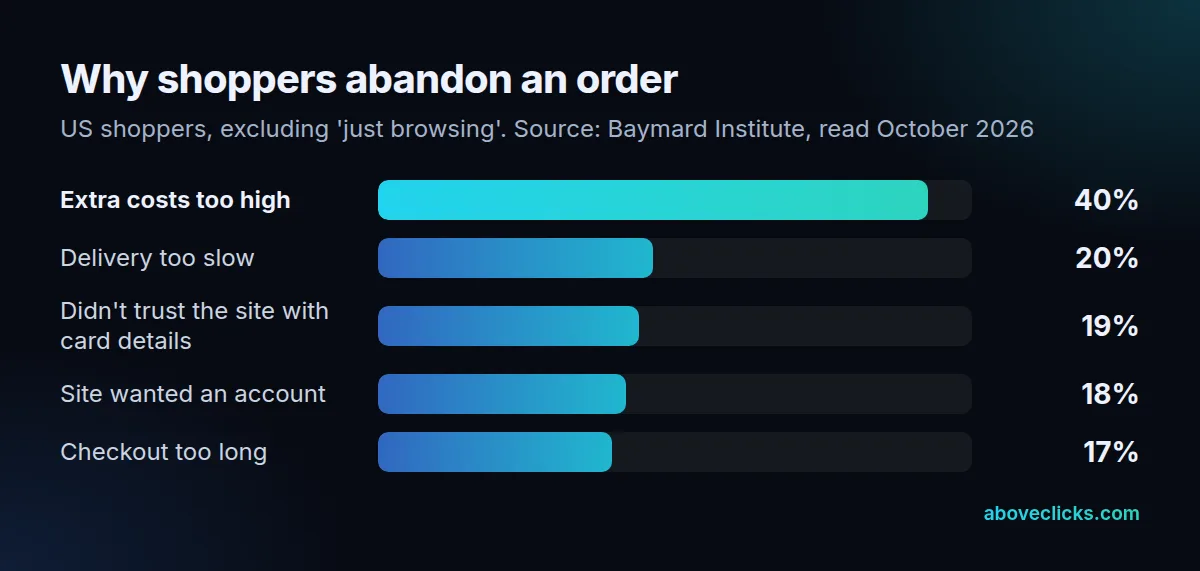
Read the chart as a to-do list. Show shipping costs and taxes on the product page or in the cart, not for the first time at payment. Offer guest checkout. Put delivery times next to the price. Show the returns policy before checkout. Each of these answers a reason buyers gave, so there is little to learn from testing them against the old version.
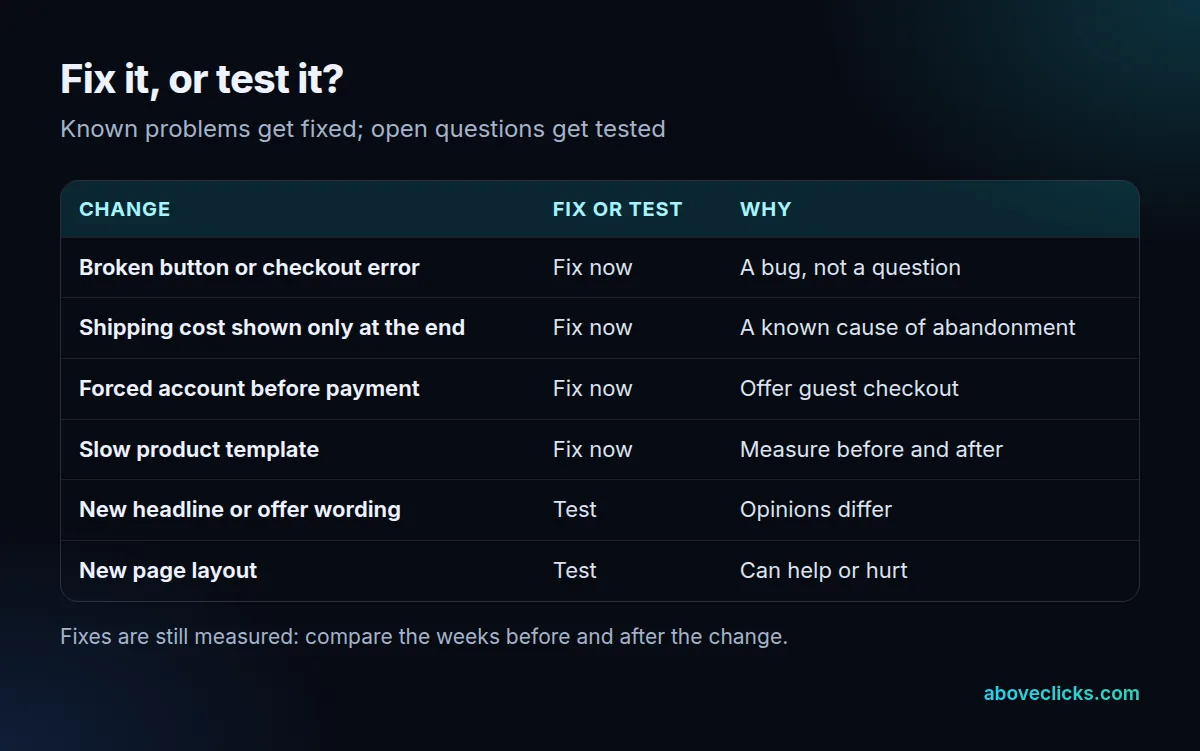
If you only have a week and want to know how to improve conversion rate fast, this is where to spend it: it is the quickest part of the work and often the most valuable. On our checkout optimization work, these fixes come before any test is planned.
How to boost conversion rate with page speed?
Speed up the templates that sell, product and checkout first, and measure them with Core Web Vitals. A slow page loses buyers before they see the offer.
As of October 2026, Google’s Web Vitals guidance sets the good thresholds at a Largest Contentful Paint of 2.5 seconds or less, an Interaction to Next Paint of 200 milliseconds or less and a Cumulative Layout Shift of 0.1 or less, measured at the 75th percentile of real visits.
Speed is also one of the few answers to how to increase conversion rate that helps every page at once, and it can be tested like any other change. In a case study on web.dev, Vodafone ran an A/B test where the faster version had a 31% better LCP, and it brought 8% more sales. That is one company’s result, not a promise, but it shows speed work can be measured in orders, not only in scores.
So if you are asking how to boost conversion rate, or how to increase the conversion rate of a store with heavy apps and large images, start with the product template. Whatever the platform, the rule is the same: measure, change, measure again.
When is an A/B test worth running?
When people disagree about a change and the page gets enough visitors to finish a test in a few weeks. Otherwise, fix it or leave it alone.
Nielsen Norman Group’s A/B testing 101 recommends working out the sample size before the test starts and running it for at least 1 to 2 weeks, even with enough traffic, to cover changes in behaviour across the week. Decide the metric and the stopping rule in advance, and don’t stop early because one version looks ahead.
Testing is the slowest way to learn how to improve conversion rate, so first check whether a page can be tested at all:
Days needed = visitors needed per version × number of versions ÷ daily visitors to the page
Worked example: if a sample-size calculator says 9,000 visitors per version, and the page gets 600 visitors a day, a 2-version test needs 9,000 × 2 ÷ 600 = 30 days. At 150 visitors a day it would need 120 days, so that page is better served by fixes and user tests. Our A/B test significance calculator reads the result once a test ends.
Pick a tool that still exists. As of October 2026, Google’s own Optimize has been gone since September 30, 2023, so older guides that rely on it are out of date.
How to increase conversion rate on Shopify?
The same order applies, with Shopify’s own limits, and the steps for how to improve conversion rate on Shopify are the ones above. Check that Shopify orders and GA4 purchases match, look at the funnel by device, fix checkout friction, then test theme changes.
Here is the one client result we publish. On our Shopify CRO page, a store’s conversion rate went from 1.59% to 2.86%, comparing 30 days before the changes with 30 days after. That was a before-and-after comparison, not a split test, and we say so on the page.
If you want to know how to increase your conversion rate on Shopify specifically, look at three things first: apps that slow the product template, shipping costs that appear only at checkout, and mobile product pages that hide delivery and returns details below the fold.
Whichever way you go about how to boost conversion rate, every finding, test and result goes into a log with screenshots and numbers. That log stops the same idea from being argued over twice, and it is the record you keep if you change agency.
How to improve conversion rate on a lead generation site?
Treat the form as the checkout. Track each submission as a lead, see where people abandon the form, and remove every field and doubt that stands between a visitor and a sent enquiry.
GA4’s list of recommended events includes generate_lead for when a visitor submits a form or a request for information. Send it only on a confirmed submission, not on a button click, or the rate will look better than it is. Then match the count against the enquiries in your inbox for the same 30 days, exactly as a store matches orders.
Knowing how to increase conversion rate on a form is mostly about removing doubt. Ask only for what you need to reply, say how fast you reply, and show what happens after the form is sent. Then check the leads themselves: a form that doubles enquiries but fills your inbox with spam has not improved anything.
The same order still applies here. Fix tracking, find the drop, fix the known problems, and test only what is left. That is how to improve conversion rate on a service site as well as on a store.
What does it cost to improve conversion rate?
It depends on how much of the work is research, fixes and testing, and on who builds the changes. A tracking check and fix list costs far less than a running test program.
We don’t publish market ranges here, because they move too fast to stay true. Instead, use these 3 questions to compare quotes on how to improve conversion rate:
- Does the work start with a tracking check and research, or with tests?
- Who builds the variants: the agency, your developer or a page builder?
- How many tests a month can your traffic support, using the formula above?
The third question changes the price most. A page with 600 visitors a day supports about 1 two-version test every 30 days, so a quote for 4 tests a month on that page is selling more than the traffic can deliver.
A one-off CRO audit suits a store that wants the fix list and plans to do the work itself. An ongoing program suits a store with enough traffic to keep testing. Our starting price cards are on the conversion rate optimization and Shopify CRO service pages linked above, and the free audit form gets you an exact plan for your store. Wondering how to increase conversion rate on ads as well? Our guides on measurement cover tracking in more depth.