MER vs ROAS comes down to scope. MER judges all ad spend against all revenue, while ROAS judges one channel’s spend against the revenue that channel claims. Manage MER when you set or change the total budget, and manage ROAS when you tune inside one platform.
This guide to MER vs ROAS defines both numbers, runs them on the same illustrative figures, and ends with a decision table for your next budget meeting. Every figure in the worked example is invented and labelled illustrative, so you can redo the arithmetic with your own numbers and see which verdict changes.
What is MER?
MER, the marketing efficiency ratio, is total revenue divided by total ad spend over the same period, across every channel. It is also called blended ROAS, because it blends every channel into one number. The numerator comes from your order system and the denominator is the sum of spend on every platform, so MER vs ROAS differs from the start: MER needs no attribution model at all. Industry glossaries define it the same way: FirstPier’s MER glossary gives the same total-revenue-over-total-spend formula, and Eightx’s MER guide works through the same ratio. On the illustrative figures used later in this guide, $120,000 of total revenue divided by $30,000 of total ad spend gives MER 4.0.
Three rules keep MER honest. First, use the same period for both numbers, usually a month. Second, count all ad spend, not just the two platforms you check most often. Third, use the same revenue basis every month, so a rise or fall in MER means performance changed, not the definition.
That simplicity is the point of MER vs ROAS as a business question. A sale enters total revenue once, however many platforms claim it, so MER cannot double-count it. What MER cannot do is tell you which channel deserves more spend; for that you need the channel view below, read with care.
What is ROAS?
ROAS, return on ad spend, is the conversion value a channel attributes to its ads divided by the spend on that channel. Google’s guide to target ROAS bidding describes the same idea from the bidding side: Google Ads predicts the value of a potential conversion and sets bids to maximise conversion value while trying to reach an average return equal to the target you set. Target ROAS is one of Google’s Smart Bidding strategies, which use Google AI to optimise for conversions or conversion value in each auction.
The word that matters in MER vs ROAS is attributed. A platform counts only the conversion value its own rules credit to its ads, so ROAS is a channel view, not a business view. Two platforms can both report strong ROAS on the same sale, because each one counts the sale in full.
Google expresses a target ROAS as a percentage, and its guide uses a 500% target as its example: $5 of conversion value for every $1 of spend, on average, across the campaign. Some platforms show the same ratio as a multiple instead, such as 5.0, which means the same thing. Either way, ROAS answers a narrow question well: for this channel, what did its ads claim back per dollar spent?
How do MER and ROAS compare on the same numbers?
The clearest way to settle MER vs ROAS is to run both formulas on one set of figures. The store below is illustrative, with invented figures, and the period is one month.
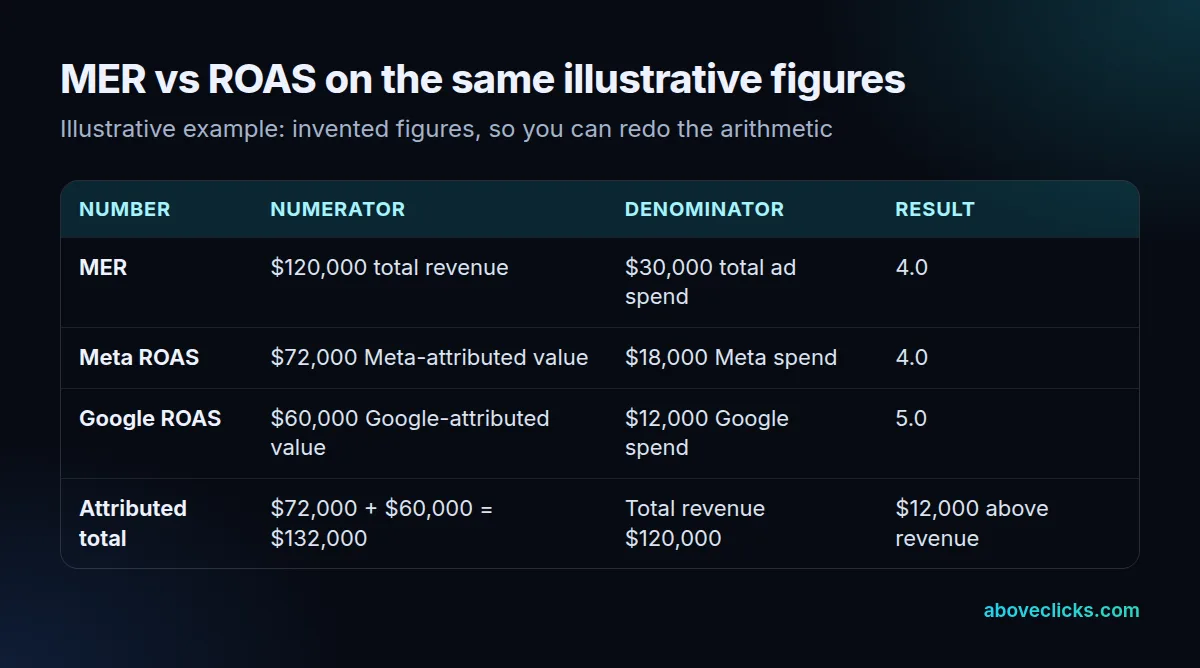
Start with MER. Total revenue of $120,000 divided by total ad spend of $30,000 gives MER 4.0: $4 of total revenue for every $1 of ad spend. Now the channels. Meta spend of $18,000 with $72,000 of Meta-attributed value gives ROAS 4.0. Google spend of $12,000 with $60,000 of Google-attributed value gives ROAS 5.0.
Now add the two attributed values: $72,000 plus $60,000 is $132,000, which is $12,000 more than the $120,000 the store actually took in. That $12,000 gap is the heart of MER vs ROAS. The channels are not lying about their own arithmetic; each one divided its own attributed value by its own spend correctly. The error comes from adding attributions together as if they were separate sales.
One more line of arithmetic matters before any budget decision. At a 40% contribution margin, $120,000 of revenue leaves $48,000 of contribution, and $48,000 minus $30,000 of ad spend leaves $18,000 before fixed costs. So MER 4.0 looks comfortable here, but only because the margin supports it, a point the break-even section returns to.
Why do platform ROAS totals add up to more than total revenue?
Because one buyer usually touches several ads before buying, and each platform credits the full sale to itself. A buyer who sees an ad on one platform, searches on another and then buys is counted in full by both, so the sum of attributed values counts that buyer twice. In the MER vs ROAS example above, that double-counting is $12,000 in a single month.
A second effect pushes the same way. Attributed value can include sales from buyers who already knew the brand and would have bought anyway, as long as they touched an ad on the way. That does not make ROAS useless; it makes it a channel signal, not a count of new money created by ads.
MER vs ROAS resolves this by counting differently. MER starts from revenue that actually arrived, counted once, and divides it by all spend. Nothing is attributed, so nothing can be double-counted. The cost of that honesty is detail: MER will not tell you whether the extra spend went to the right channel, which is why the next section keeps both numbers, each in its own job.
MER vs ROAS: which number should you manage to?
The decision picks the number, not the dashboard you happen to have open. Use MER for anything that moves total spend or judges the business, and use ROAS for anything that happens inside one platform. The MER vs ROAS table below makes that rule concrete.
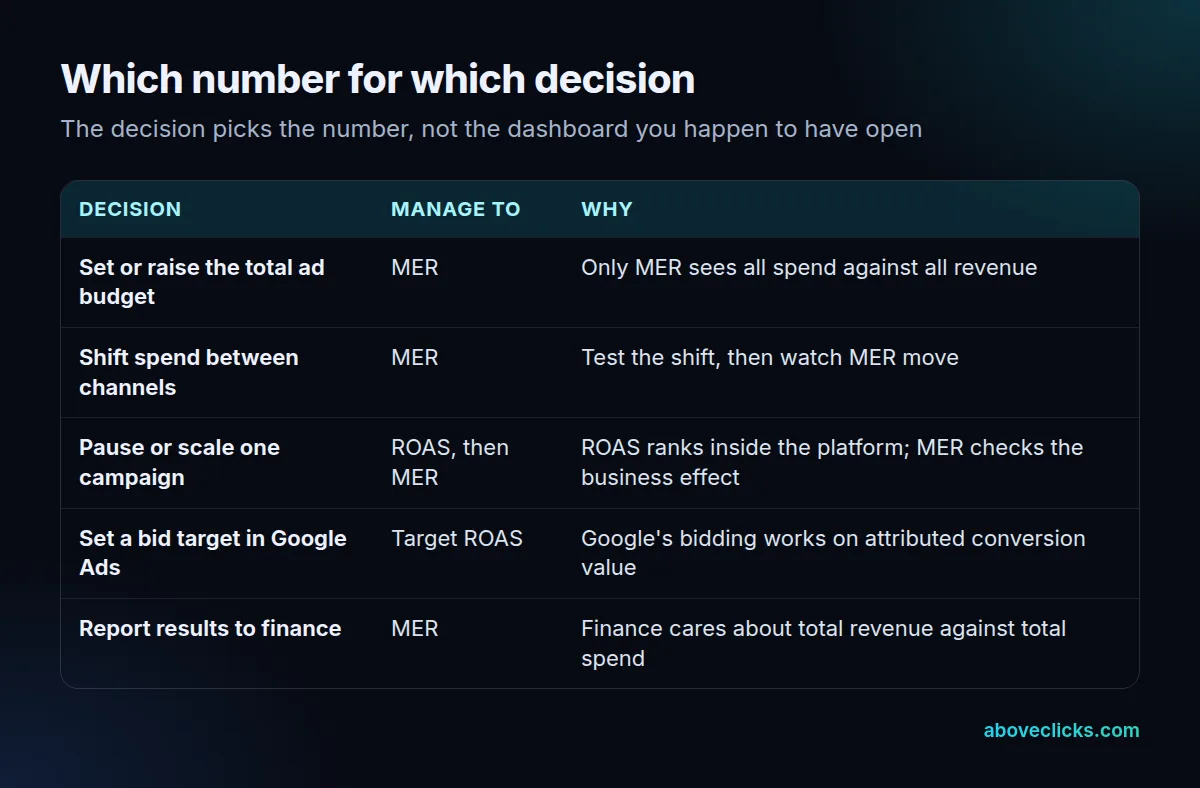
Work through the table with a real choice. Suppose you want to raise total spend by $10,000 next month. That is a MER decision: forecast total revenue at the new spend, divide by the new total spend, and check the result against break-even. Suppose instead you want to pause one weak ad set inside a platform. That is a ROAS decision first, because only that platform’s ROAS ranks its own ad sets, and a MER check second, to confirm the business got more efficient after the pause.
The common failure in MER vs ROAS is using one number for the other’s job. Judging the whole budget by one channel’s ROAS flatters the business whenever that channel double-counts. Judging one ad set by MER hides it completely, because MER cannot see inside a channel. Keep the two jobs apart and both numbers stay useful. Google’s own guide to picking a bid strategy puts Target ROAS among the strategies for getting as much conversion value as possible at a fixed return on ad spend, which is why it belongs to the in-platform job, not the budget job.
How do you set a break-even target for MER vs ROAS?
Break-even is 1 divided by your contribution margin, and it applies to MER vs ROAS in the same way. Contribution margin here means revenue minus the variable costs of fulfilling orders, before ad spend and before fixed costs. Work it out on your own numbers, not on a benchmark, because margin is what turns the same ratio into opposite verdicts.
- At a 50% contribution margin, break-even is 1 divided by 0.50, which is 2.0.
- At a 40% contribution margin, break-even is 1 divided by 0.40, which is 2.5.
- At a 25% contribution margin, break-even is 1 divided by 0.25, which is 4.0.
Now read the earlier MER vs ROAS example against those lines. MER 4.0 sits well above break-even 2.5 at 40% margin, leaving $18,000 before fixed costs on the illustrative figures. The same MER 4.0 sits exactly on break-even 4.0 at 25% margin, leaving nothing before fixed costs. Nothing changed in the ads; only the margin changed, and the verdict flipped.
Apply break-even to MER for budget calls. A channel ROAS can be compared with the same break-even line only if that channel’s attributed value equals real revenue, which double-counting usually prevents. For a channel, the safer comparison is its own past ROAS on the same basis, month after month, while MER carries the profit verdict.
Which costly mistakes distort MER vs ROAS?
Three mistakes distort MER vs ROAS more than any other, and all three are easy to make in a busy reporting week.
- Adding platform ROAS figures together. Summed attributions count the same sales twice, as the $12,000 gap above shows. Add spend if you must add anything, and let MER do the blending.
- Judging profit from ROAS alone. A ROAS of 4.0 on a 25% margin product is only break-even before fixed costs, while a ROAS of 3.0 on a 50% margin product clears break-even by a full point. Without margin, the ratio cannot tell you whether you made money.
- Changing the revenue definition between months. If one month’s MER uses gross revenue and the next uses revenue net of refunds, the trend means nothing, however clean the chart looks. Fix the definition once, write it down, and use it every month.
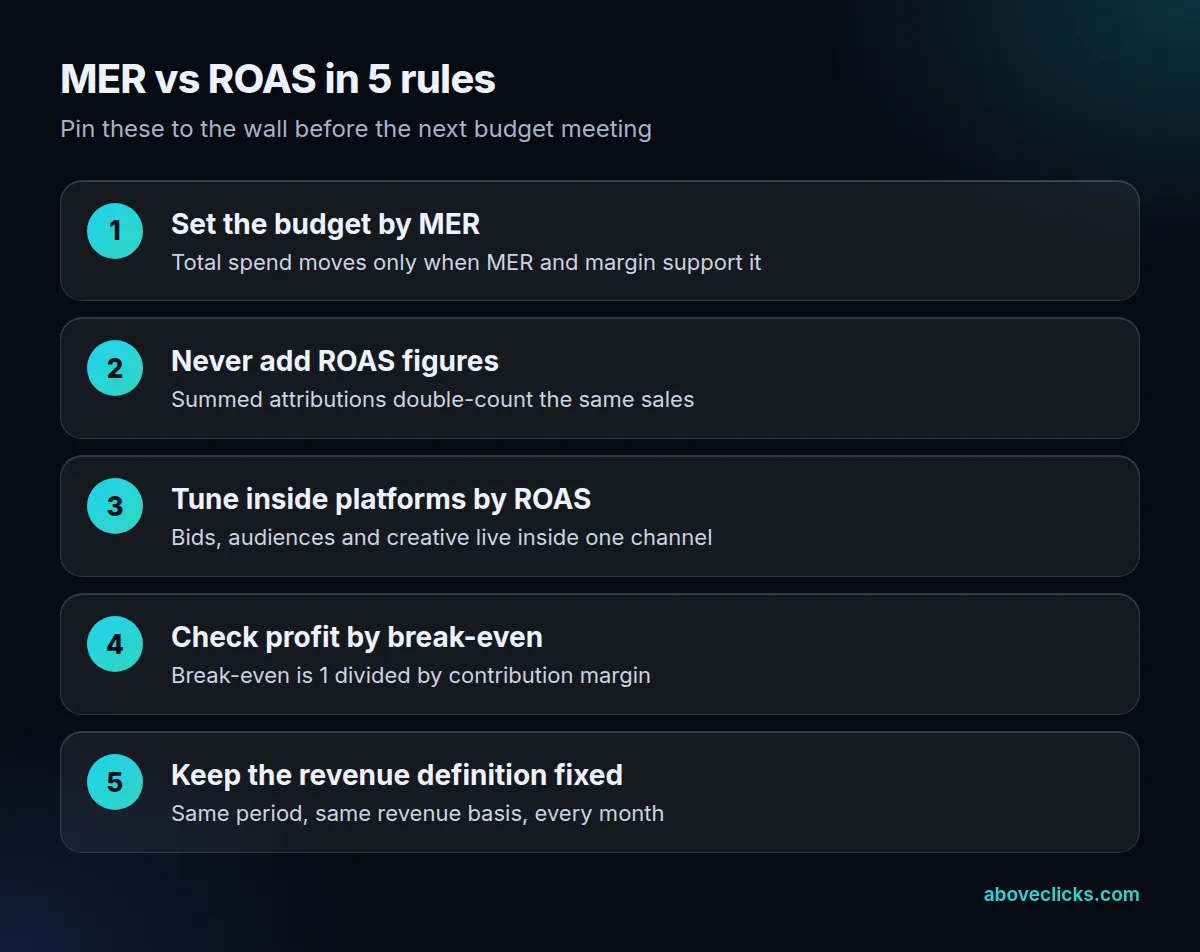
Close with the routine that avoids all three. Start with MER for the budget, use ROAS inside each platform, and check both against break-even before you move money. That is the whole MER vs ROAS routine: one number for the business, one number for the channel, and neither one alone as a profit verdict. To see how we would read your numbers before you move budget, start with the free audit. More measurement guides are in measurement, and if you are choosing who runs the ads, start with questions to ask a marketing agency.