A position based attribution model gives most of the credit for an order to the first and last touches and shares the rest across the middle, usually 40-20-40. Google removed it from GA4 and Google Ads in November 2023.
This guide shows how the split works on one order, where you can still use it, and how to test whether it would change a budget decision.
What is a position based attribution model?
A rule that splits the credit for one order across the marketing touches before it, weighted by position. The first and last touches get 40% each in the usual version; the touches in between share the other 20%.
The idea is simple. The first touch is how the shopper found you. The last touch is what closed the order. Those two usually matter most, but the emails and searches between them did something too. A position based attribution rule lets you give them some credit without ignoring the two ends.
The position based attribution model is one of several rule-based models. Last click gives everything to the final touch. First click gives everything to the first. Linear gives each touch the same share. Position based sits between them, and some tools call the same position based attribution rule a U-shaped model.
Google’s own help page is direct about its status. It says the first click, linear, time decay and position-based models are no longer available as of November 2023 in GA4. The rest of this guide covers what to do instead, so you can still use a position based attribution model on your own orders.
How does the 40-20-40 credit split work?
The first touch gets 40%, the last touch gets 40% and the touches between them share the other 20% equally. The credit always adds up to 100% of the order value.
Here is a worked example with an invented skincare store. A shopper pays $120 for an order after four touches over 12 days: a Meta ad on day 1, an email on day 6, an organic search visit on day 9 and a Google paid search click on day 12.
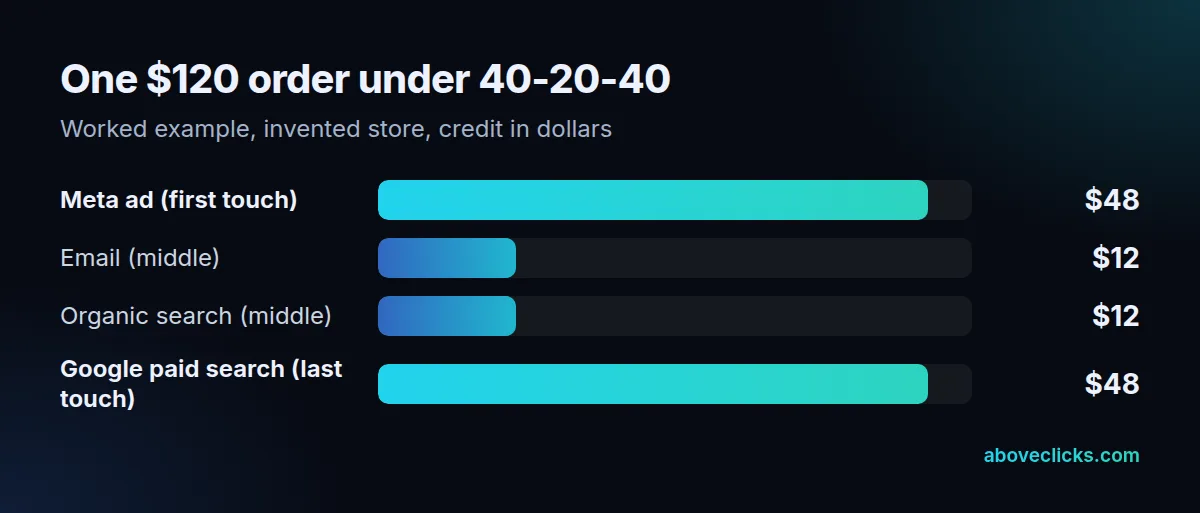
The first and last touch get $48 each (40% of $120). The two middle touches share $24, so each gets $12. Nothing is lost or created: $48 + $12 + $12 + $48 = $120.
Check the arithmetic on a second order to see the pattern. A $200 order with five touches gives $80 to the first, $80 to the last and $40 split three ways across the middle, about $13.33 each. The more touches in the middle, the less each one earns, which is why long journeys make middle channels look small.
Two edge cases matter. With one touch, that touch must get 100%. With two touches there is no middle, so a tool has to decide. Adobe’s documentation for its U-shaped model gives a single touch 100% and splits two touches 50-50. Other tools may differ, so read the definition before you compare numbers.
The weights are a choice, not a measurement. Nobody has shown that a first touch is worth exactly twice a middle touch. Treat the position based attribution model as a way to ask a question, not as the answer. A shopper who buys after 2 touches, or after 12, gets the same rule applied either way.
How is it different from U-shaped and W-shaped models?
A U-shaped model is the same idea with the same weights: it gives 40% to the first touch, 40% to the last and 20% to the middle, as Adobe documents. A W-shaped model adds a third peak.
Names vary by tool, so the label matters less than the rule. Both the u shaped attribution model and the position based attribution model describe the same 40-20-40 idea. Some tools call 40-20-40 “position based”, others call it “U-shaped”. Check the definition on the vendor’s page.
A w shaped attribution model puts large shares on three moments: the first touch, the touch that created a lead or a key step, and the last touch. The usual convention is to give those three equal large shares and split a small remainder across the other touches. Treat that as a convention, because vendors set it differently.
For most online stores, the W shape is hard to use. It needs a clear middle milestone, such as an account sign-up or a started checkout, recorded on every path. Stores that buy in one visit rarely have one. The u shaped attribution model, or plain 40-20-40, is the simpler place to start.
Which attribution models can you still use in GA4, Google Ads and Shopify?
GA4 and Google Ads offer data-driven and last click. Shopify offers five click-based models, none of them position based. You can still use 40-20-40 by exporting touch data and applying the weights yourself.
Google Ads says in its attribution models help page that position-based and the other older models are no longer supported, that conversion actions using them were upgraded to data-driven attribution, and that last click is still supported. GA4 lists data-driven, paid and organic last click, and Google paid channels last click.
Shopify’s marketing reports offer five models: last non-direct click (the default), last click, first click, any click and linear. Shopify also resets the first interaction after 30 days without a purchase, so a long journey can lose its true first touch.
Windows matter for the same reason, and they decide which touch counts as “first”. As of an August 2026 release note, GA4 lets you set click-through conversion windows from 1 to 90 days. A shorter window cuts off early touches, and a position based report then rewards whatever is left as the “first” touch.
So the practical routes to a position based attribution model are three: export path data from your analytics or order data and apply 40-20-40 in a sheet; use a third-party tool that offers it; or compare data-driven attribution with last click and accept the platforms’ own choice.
Would position based attribution change a spending decision?
It can, and that is the only reason to use it. If last click and 40-20-40 lead to the same budget, the model does not matter for that channel.
Test the position based attribution model on a channel that usually starts journeys. Say the Meta ad in the example above cost $40 to start each order like this one. Under last click it gets $0 of the $120 order, so it looks like a $40 loss. Under 40-20-40 it gets $48 of credit, so it looks like an $8 gain before costs.
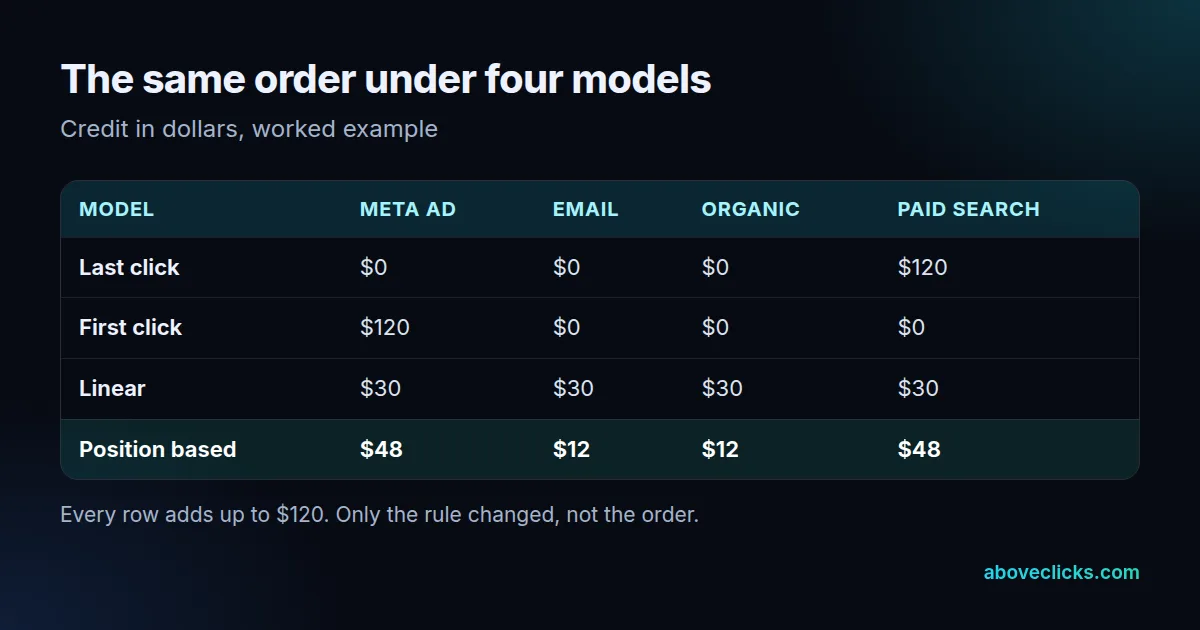
The decision flips with the rule, which is the lesson. Neither number proves the ad works. What the table shows is how much of a budget call rests on a rule you chose. If your top-of-funnel channel only looks bad under last click, run a holdout or a lift test before you cut it.
Judge the credited share against margin, not revenue. $48 of credit on a $120 order is revenue. If the product margin is 50%, the credited profit is $24 against a $40 cost. Do the margin step before you move any money.
Our rule on audits is to put last click and one spread model side by side on the same orders for one full month, then list the channels whose verdict changes. Only those channels need a deeper look. Our ecommerce attribution service does this comparison on your data, and the sample report shows how we lay out the findings.
When does a position based attribution model fit an online store?
When journeys have several touches over days, you track more than the last one, and a decision depends on how first and last touches are valued. It fits poorly for one-visit purchases.
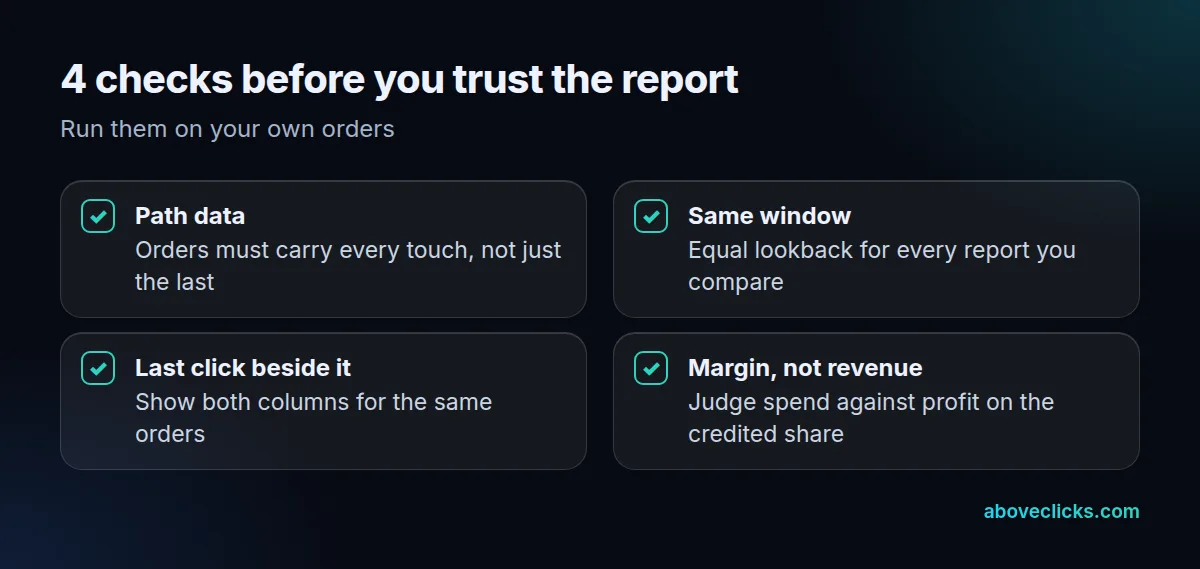
Use this short list before you trust a report:
- Path data exists. Your orders must record every touch, not only the last. Without it, the model has nothing to split.
- The window is the same everywhere. A 7-day and a 90-day report cannot be compared.
- Last click sits beside it. Show both columns for the same orders.
- You judge profit, not revenue. Convert the credit to margin before you act.
It fits well for a store selling a considered product, such as furniture or skincare sets, where people see an ad, read an email and come back through search. It fits poorly for a store whose buyers arrive from one source and buy on the first visit, because the middle share is empty and the model reduces to first and last click.
Be careful with small samples in any position based attribution model report. A month with 40 orders can swing a 40-20-40 report by a single large order. Look at three months before you act, and check that tracking records the same touches in every month.
A few more questions are worth asking of any report that uses this rule. Which touches does it count: clicks only, or views too? Does it merge direct visits into the touch before them? Are returns and cancelled orders removed before the split? Each answer changes the numbers more than the choice between 40-20-40 and 30-40-30 would.
If you want a second opinion on how your store credits its channels, our tracking and analytics work starts with a read-only look at your setup, and the free audit is the quickest way to ask for one. More guides are in measurement.