Market research for higher education is how a college finds out, before it spends, whether enough of the right students want a program. Do it in five steps: set the decision, read public data, check search demand, survey prospects, then score the result.
This guide gives a plan for market research for higher education: one step at a time, with a sample-size calculation for a survey of prospective students and a go, hold or stop test. Every example is invented and labelled, so you can swap in your own numbers.
What is market research for higher education?
It is the evidence you gather on student demand, competitors and your own enquiries before you launch or change a program, campaign or recruitment plan. It supports one decision, not a general report.
Market research in higher education has to be local to your program, because national totals hide big differences. The Western Interstate Commission for Higher Education (WICHE) projects that the number of high school graduates will peak in 2025 and then decline steadily through 2041, a 13% fall from the peak. It also expects 38 states to have fewer graduates in 2041 than in 2023.
Enrollment today tells a different story. The National Student Clearinghouse Research Center’s preliminary fall report, published on October 29, 2026, shows undergraduate enrollment up 0.6% on a year earlier as of September 24, 2026. A flat national total can still hide a growing master’s market or a shrinking local one, so your own region and program are what to measure.
Three features set higher education market research apart from consumer research:
- The decision runs through application deadlines and intake dates, so timing matters as much as interest.
- The people you can reach already, such as enquirers and applicants, are a ready sample.
- Public data for market research for higher education is unusually good, as the next sections show.
Which questions should market research for higher education answer first?
Start with the decision, then list the questions that would change it. If no answer could change the decision, skip the question.
Here is the whole plan on one page.
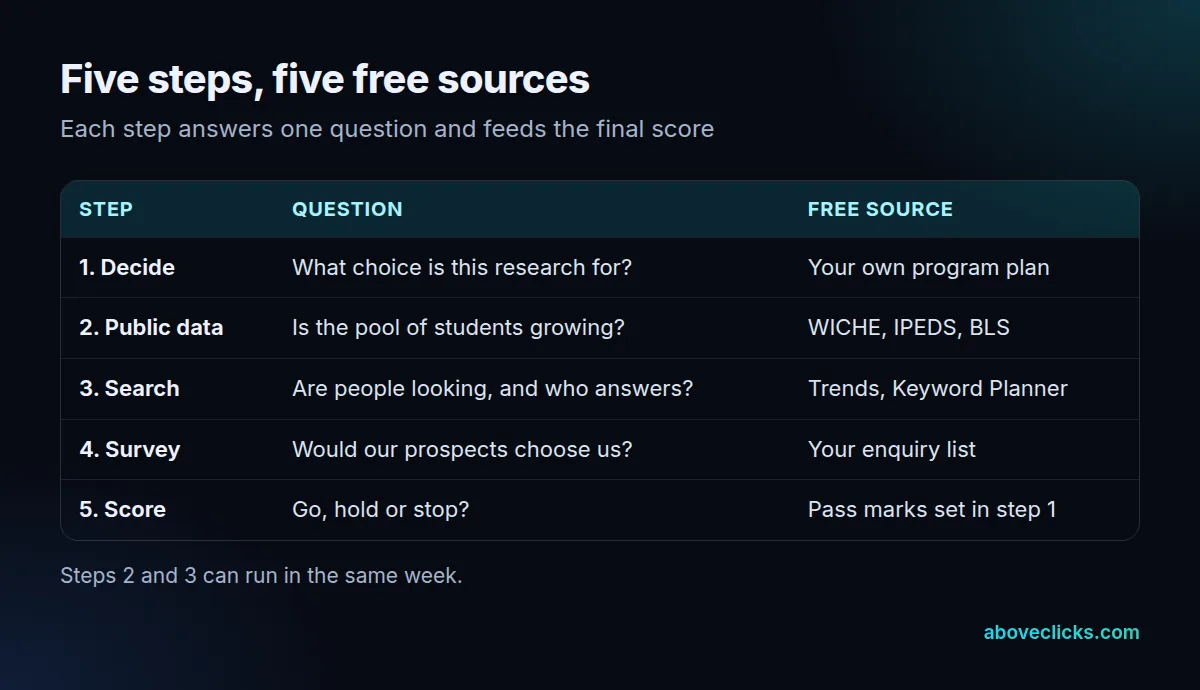
Step 1 is to write the decision in one line. Our example: a college with 2,000 past enquirers is deciding whether to launch a 12-month online master’s in data analytics this fall, hold it for a year, or stop. Write the pass marks now, before any data arrives, so the result can’t be bent to fit a hope. Step 5 uses them. That discipline is what turns market research in higher education from a report into a decision.
Then add the questions that look past the launch. Persistence is one, and it belongs in any market research for higher education that backs a new program. According to the Clearinghouse’s persistence report, published June 25, 2026, 85.8% of the nearly 2.62 million students who entered college in fall 2024 continued into spring 2025, and 77.1% were still enrolled by fall 2025. If your plan counts on students staying, compare your own figures with those.
What can public data tell you before you survey anyone?
More than most teams use, which makes public data the cheapest part of higher education market research. The federal IPEDS system covers colleges that take part in federal student aid programs, and reporting is mandatory for them, so it is the widest source of comparable program and enrollment data.
Use it before any survey in market research for higher education, so you don’t ask students what the data already shows. The IPEDS Data Center offers data files for more than 7,000 institutions and up to 250 variables, with complete files from the 1980-81 collection year. Its Data Feedback Report compares an institution with peer institutions you choose. You can see enrollment, completions, tuition and fees, and admissions for the peers that matter to your decision.
For a program decision, add two more checks:
- Who offers it. Use College Navigator to list institutions by program, award level, institution type and distance education, and within a distance of up to 250 miles from a ZIP code. In the example, the college lists every institution within 100 miles and every online peer that offers a data analytics master’s, then records the award level, tuition and fees and enrollment size for each.
- Where the jobs are headed. The Bureau of Labor Statistics Employment Projections program covers the nation 10 years ahead, and its latest release is for 2025 to 2035. Look up the occupations your graduates would enter and note the projected direction, not a single number.
How do you check search demand and competitors?
Compare how often people search for your program with how often they search for one you already run. That gives you a scale without needing an exact count.
Google Trends is built for that kind of market research for higher education. Google describes its data as a sample of real searches, scaled from 0 to 100, with low-volume terms shown as 0. So put the new program’s name next to your flagship’s and read the ratio. If interest in the new program is a small fraction of the flagship’s, you know the scale, even though no search count appears.
For counts, Google Ads’ Keyword Planner shows estimated monthly searches, but keywords with very low volume aren’t discoverable. A blank result on a niche query is itself information: demand may be too thin to reach by search.
Then read your own Search Console data. Google’s traffic-drop guide suggests setting the Performance report to the last 16 months, which shows yearly seasonality. Admissions has strong seasons, so compare each month with the same month last year. Note which queries bring people to your program pages today, such as the degree name plus “online” or “part time”; they show the words real prospects use, and those words belong in the survey.
To size up competitors in higher education market research, search the program’s main terms in a private window and record who appears, which format they offer and what each page leaves out. In the example, that might be part-time evening classes that nobody answers well.
How do you survey prospective students?
Ask people who have already shown interest, with short questions about what they did and what they need. This is the primary-research half of market research in higher education. A survey of your own enquiry list is the cheapest primary higher education market research there is, and it needs no outside panel.
Start with three groups: enquirers who never applied, applicants who chose elsewhere, and enrolled students who can say why they picked you. Keep it to about eight questions. Good ones cover the program, the study format, the start date, the three things they compared and the deal-breaker. Asking what people have done, such as visiting a page or requesting a brochure, is easier to trust than asking what they might do.
Send it from a named person at the college with a clear reason and a deadline, since a plain request from a human gets more replies than a form letter. Read the open answers yourself and tally the repeated words; they often reveal the deal-breaker better than any scale question.
Privacy needs a check first. Under the Family Educational Rights and Privacy Act, FERPA rights pass to the student at age 18 or on entering a postsecondary institution at any age. If a survey uses education records, ask your registrar or counsel which rules apply. This isn’t legal advice.
How many survey responses do you need?
In market research for higher education, a large population at 95% confidence and a 5-point margin needs 385 responses. A small list needs fewer, but you will rarely get them all.
The formula for a proportion is n = z² × p × (1 − p) ÷ e². Use z = 1.96 for 95% confidence, p = 0.5 when you don’t know the answer in advance, and e = 0.05 for a 5-point margin. That gives 1.96² × 0.25 ÷ 0.0025 = 384.2, so 385.
Now apply it to the example list of 2,000. A small-list correction divides by 1 + (n − 1) ÷ N, so 384.2 ÷ (1 + 383.2 ÷ 2,000) comes to about 323 responses. Assume a 10% response rate, which is our invented figure and not a benchmark. Inviting all 2,000 then brings about 200 replies, and the same method gives a margin of 6.6 points.
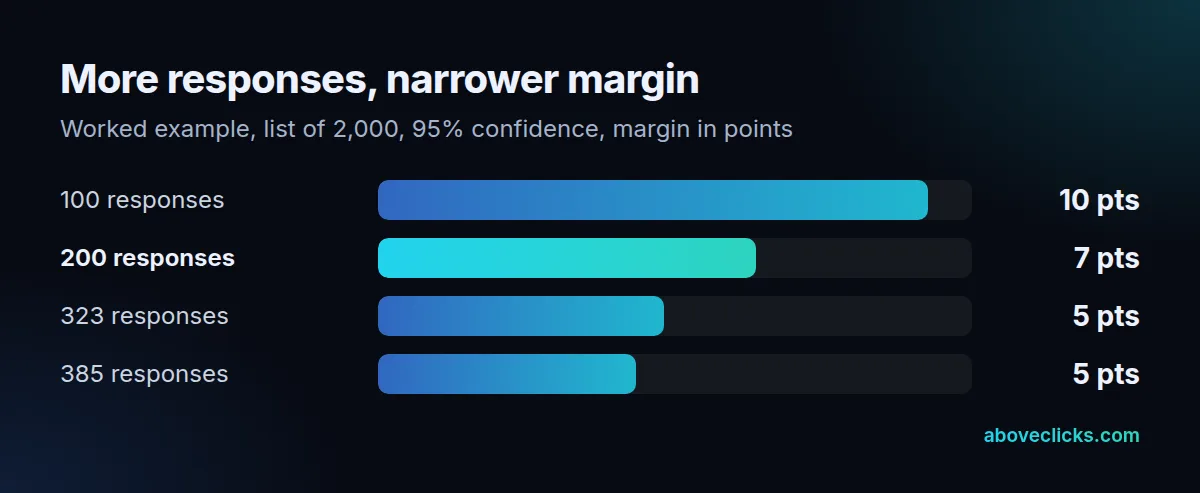
In practice, a sample-size table is part of any market research for higher education that relies on surveys. If 40% of 200 respondents say they’re very interested, the true share among all 2,000 could plausibly sit between about 33% and 47%. That is enough to test a 30% pass mark, but not to separate 38% from 42%. The margin also covers sampling error only: people who answer are often keener than those who don’t, so treat the figure as a ceiling.
How do you turn the findings into a go, hold or stop decision?
Score each result from your market research for higher education against the pass mark you wrote in step 1. All five passing means go, three or four means a small pilot or a hold, and fewer than three means stop.
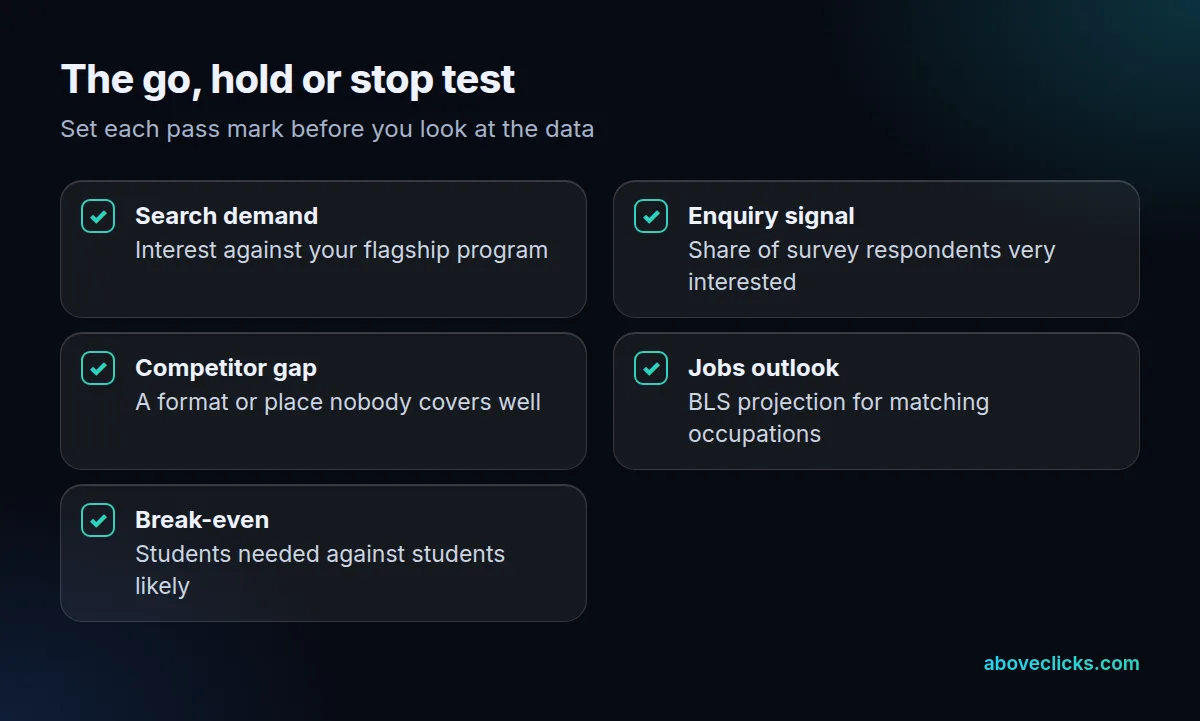
Take break-even. In our invented example, fixed costs come to $240,000 over a full year, and each student brings $12,000 after discounts. Dividing $240,000 by $12,000 gives 20 students, which is 1% of the 2,000-person list. If the survey and the competitor check make 1% look out of reach, the break-even mark fails, however good the search demand looks.
Write the other pass marks the same way, for example “interest at least half of the flagship program’s” or “30% of respondents very interested”. The numbers are yours to choose, which is the point: they are fixed before the data arrives, and the whole higher education market research effort then answers a question you asked in advance.
Good higher education market research ends with a decision, not a slide deck. We run education marketing the same way round. On our education marketing page we explain that we plan backwards from the intake: when applications close, how long a family takes to decide and how many counselor conversations a seat needs. The free education marketing audit reads your website, ads and enquiry path, and sends a PDF report within 2 workdays. For a wider look at your site and accounts, see our marketing audit, the sample report and our work on lead generation ads. You can also request the free audit. More guides are in industry guides.