Contribution margin is the share of each sale left after the variable costs of making that sale: product cost, shipping and packing, payment fees, and returns and discounts. It's what an order contributes toward ad spend, fixed costs and profit. For an online store, it decides how much you can afford to pay for an orde
FormulaContribution margin = (revenue − variable costs) ÷ revenue
Contribution margin is the share of each sale left after the variable costs of making that sale: product cost, shipping and packing, payment fees, and returns and discounts. It’s what an order contributes toward ad spend, fixed costs and profit. For an online store, it decides how much you can afford to pay for an order.
The formula, and which costs count
Contribution margin = (revenue − variable costs) ÷ revenue
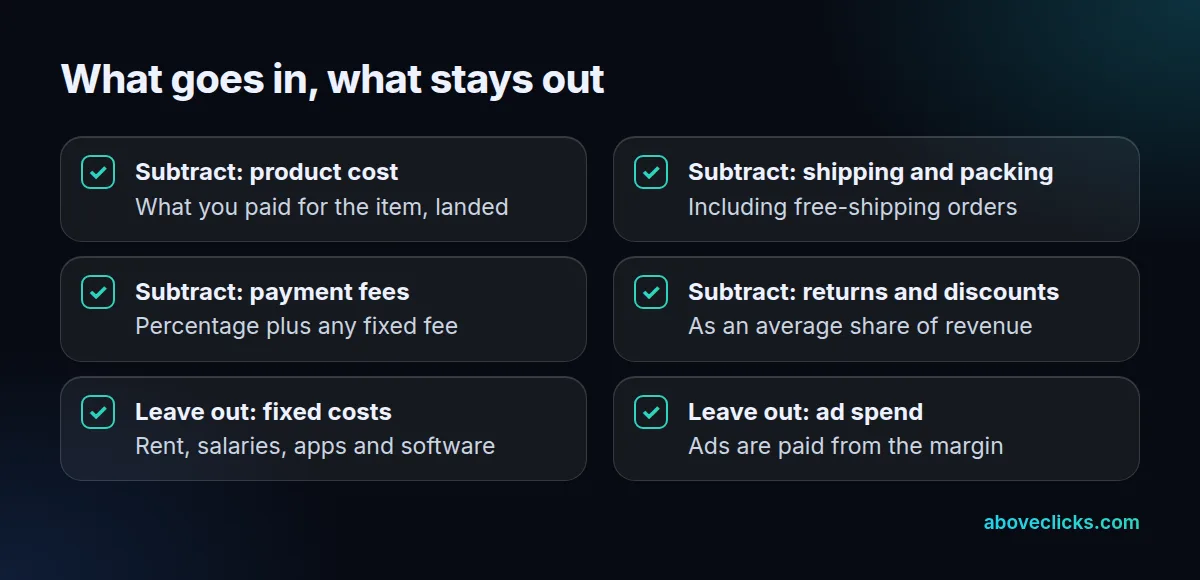
Variable costs are the ones that rise with every order. Product cost is the easiest to get right if it’s stored per product: Shopify lets you add a cost per item to each product to track costs and profits. Fixed costs, like rent, salaries and your Shopify plan, stay out because they don’t change when one more order comes in. Some teams also subtract ad spend and call the result contribution after marketing. Here we keep ads out, because this margin is the money ads are paid from.
How to calculate it: a $120 order
Take a hypothetical home-goods store. A customer buys a $120 throw blanket. Here are the 4 costs to include, line by line:
| Line | Amount |
|---|---|
| Revenue | $120.00 |
| Product cost | −$42.00 |
| Shipping and packing | −$13.00 |
| Payment fees (2.9% + $0.30, an example rate) | −$3.78 |
| Returns allowance (6% of revenue) | −$7.20 |
| Contribution | $54.02 |
$54.02 ÷ $120 = 45.0%. That’s the store’s contribution margin on this order. We entered the same four costs into our own break-even ROAS calculator as a check, and it returned the same $54.02 contribution, 45.0% margin and a 2.22 break-even ROAS.

Returns and discounts are easiest to handle as an average. If 6% of revenue comes back as refunds across the year, take 6% off every order, as the example does.
Contribution margin vs gross margin
Gross margin subtracts only the product cost. For the same order, that’s ($120 − $42) ÷ $120 = 65%.
Google Ads can show you gross profit if you send cart data with your conversions and add a cost of goods sold value to your Merchant Center feed (Google Ads Help). Google defines gross profit there as revenue minus the cost of goods sold, and says a rough average is fine (Merchant Center Help). That report is useful, but shipping, fees and returns aren’t in it.
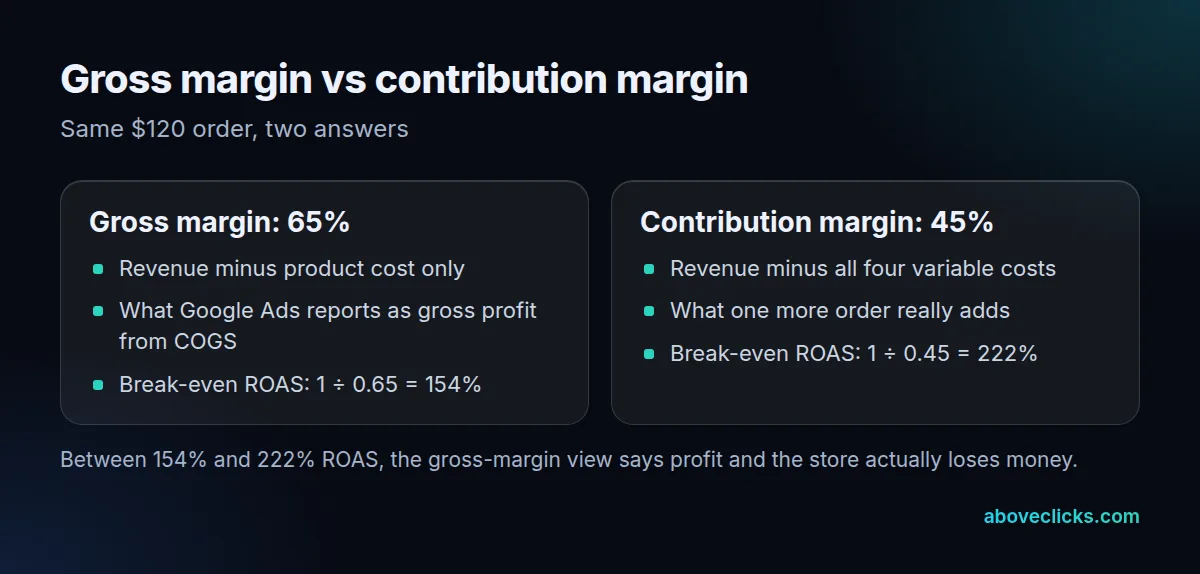
The gap matters. At 65% gross margin, break-even ROAS looks like 154%. At the true 45% contribution margin, it’s 222%. Any campaign running between the two looks profitable and isn’t.
Why contribution margin sets your ad targets
Two numbers fall straight out of it:
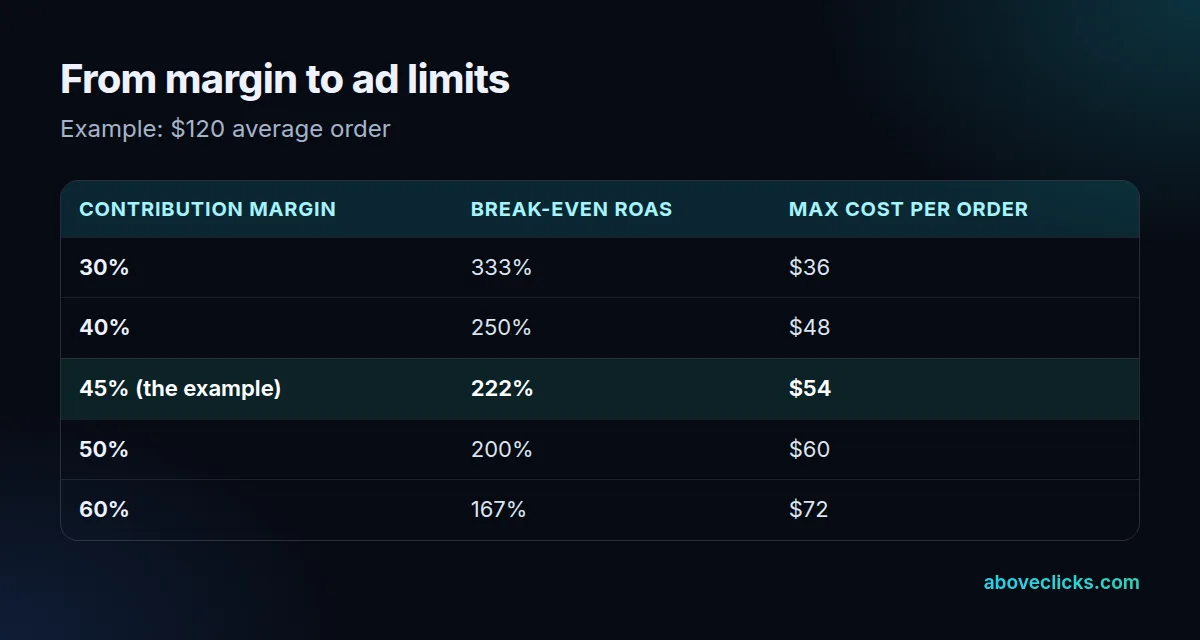
- Break-even ROAS = 1 ÷ contribution margin. For the example, 1 ÷ 0.45 = 222%. Check any return on ad spend against this line.
- Maximum cost per order = contribution in dollars. The store can pay up to $54 in ads for a $120 order and still break even. That’s the ceiling for your cost per acquisition.
The calculator does this math from your own costs. To turn the result into a bid target with profit built in, see our guide to target ROAS bidding.
Where stores get it wrong
In our client work, missing costs are the first thing we look for when a margin looks too good: free shipping that isn’t counted because the customer didn’t pay it, or fees on refunded orders. Margins also differ by product, so a store-wide average can hide items that lose money on every ad-driven sale. If your numbers live in three systems and don’t agree, our tracking and analytics service starts there. For how margin feeds into budgets and scaling on Meta, see the Meta ads for e-commerce guide.